IMAGE

Figure 3

ID
ZDB-IMAGE-200811-18
Source
Figures for Goodman et al., 2020
Image
Figure Caption

Figure 3

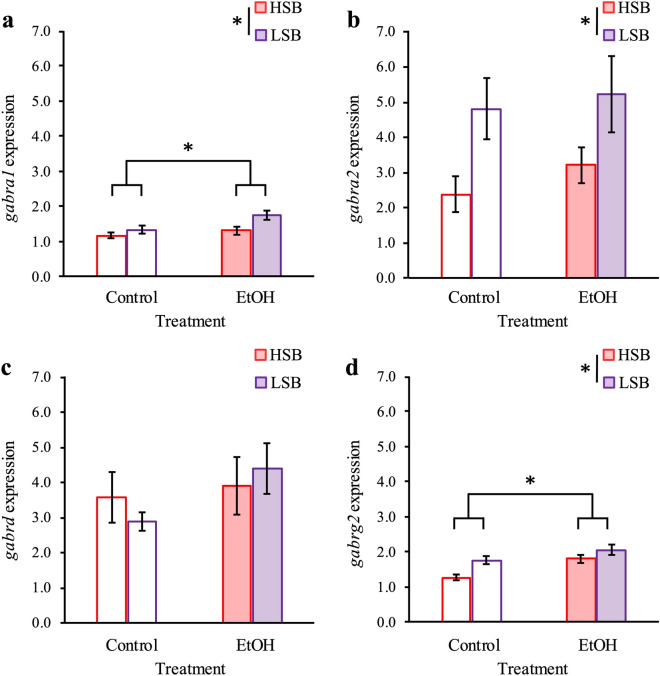
Effect of line and treatment on GABAA receptor subunits. Normalized expression of gabra1 (a), gabra2 (b), gabrd (c), and gabrg2 (d) for each treatment group following treatment. Control groups are represented by unfilled in bars, while ethanol-treated groups are represented by filled bars. HSB and LSB are red and purple, respectively. Data shown are mean ± 1 SEM. Significant differences are indicated by an asterisk (p ≤ 0.05). The number of subjects tested in each group are as follows: 17 HSB control, 18 LSB control, 17 HSB EtOH, 17 LSB EtOH.

Acknowledgments
This image is the copyrighted work of the attributed author or publisher, and ZFIN has permission only to display this image to its users. Additional permissions should be obtained from the applicable author or publisher of the image. Full text @ Sci. Rep.