
Image
|
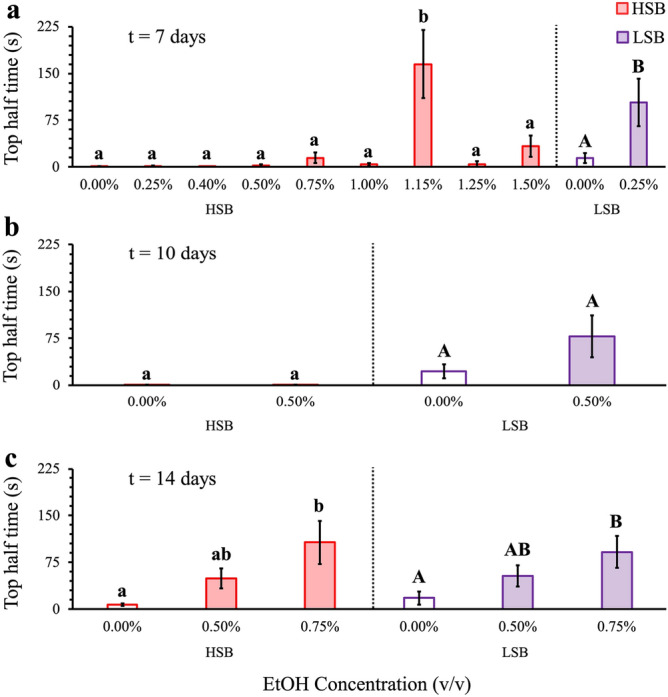
Figure Caption
Figure 1
Dose response analysis of ethanol concentration on time spent in the top half of the tank during NTDT. Measured time spent in the top half of the tank after (
Acknowledgments
This image is the copyrighted work of the attributed author or publisher, and
ZFIN has permission only to display this image to its users.
Additional permissions should be obtained from the applicable author or publisher of the image.
Full text @ Sci. Rep.