
Image
|
Figure Caption
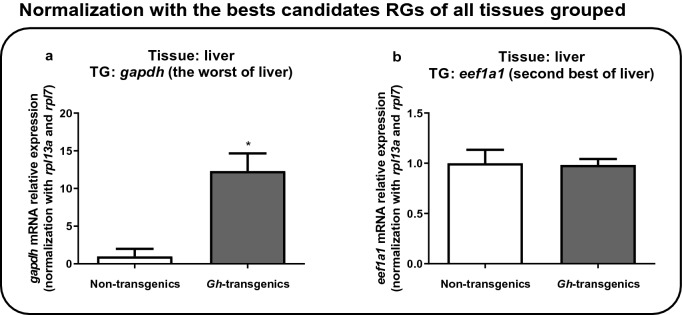
Figure 8
Verification of the suitability of the reaction when normalized with the candidate reference genes ranked as the best for all tissues grouped (
Acknowledgments
This image is the copyrighted work of the attributed author or publisher, and
ZFIN has permission only to display this image to its users.
Additional permissions should be obtained from the applicable author or publisher of the image.
Full text @ Sci. Rep.