
Figure 7
- ID
- ZDB-IMAGE-200801-35
- Publication
- Yoshimatsu et al., 2020 - Fovea-like Photoreceptor Specializations Underlie Single UV Cone Driven Prey-Capture Behavior in Zebrafish
- All Figures
- Figures for Yoshimatsu et al., 2020
|
Figure 7
Tuning of Phototransduction Cascade Elevates SZ Baseline
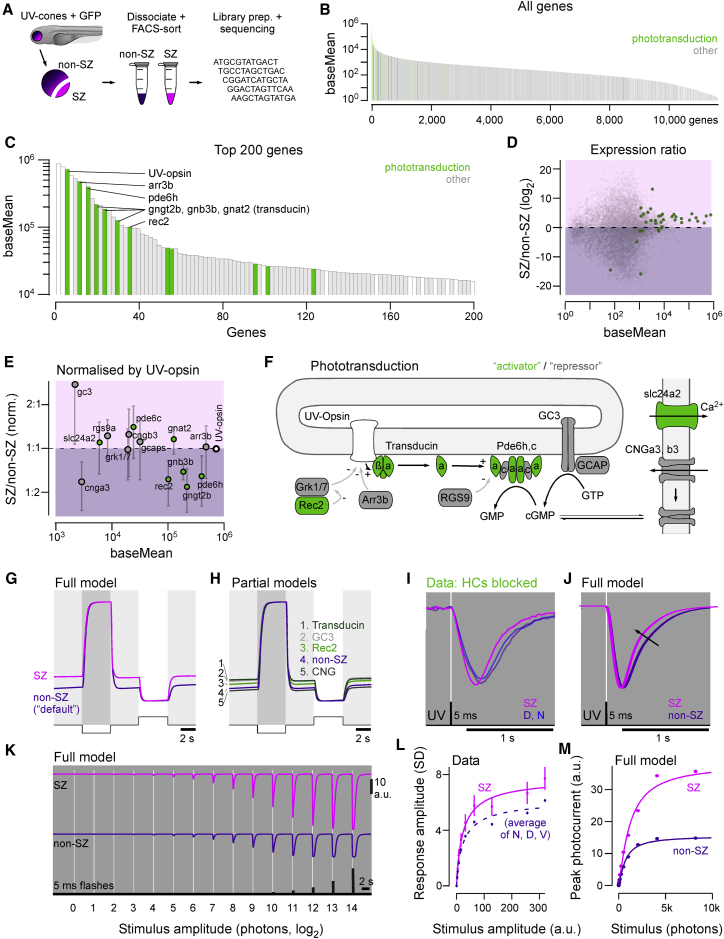
(A) UV cone RNA sequencing (RNA-seq) workflow. Retinas from 7 dpf zebrafish
(B and C) All detected genes in UV cones ranked by expression label, with phototransduction genes highlighted (B), and zoom in to the top 200 genes (C). The two most highly expressed genes are both non-protein-coding genes; therefore, UV opsin is the highest expressed protein-coding gene.
(D) Mean gene expression ratio between SZ and non-SZ batches, with phototransduction genes highlighted.
(E) As in (D), but normalized to UV-opsin expression level in each batch and zoomed in to high expression phototransduction targets. Green and gray markers denote activators and repressors of the photo-response, respectively. Error bars represent SEM.
(F) Schematic of phototransduction based on
(G) Simulated current response of SZ and non-SZ UV cones to 100% dark and light contrasts from a 50% contrast background based on
(H) Effects of expression changes of individual phototransduction components compared to non-SZ.
(I) Mean calcium responses to a flash of light from darkness in SZ, nasal, and dorsal UV cones from
(J) Output of full phototransduction model to an equivalent stimulus between SZ and non-SZ batches.
(K) Full model output to a series of increasing amplitude 5-ms light flashes from darkness for SZ and non-SZ batches.
(L and M) Stimulus-response data from SZ and average of non-SZ data (N+D+V) from