
Fig. 2
- ID
- ZDB-IMAGE-200728-54
- Publication
- Rago et al., 2019 - MicroRNAs Establish the Right-Handed Dominance of the Heart Laterality Pathway in Vertebrates
- All Figures
- Figures for Rago et al., 2019
|
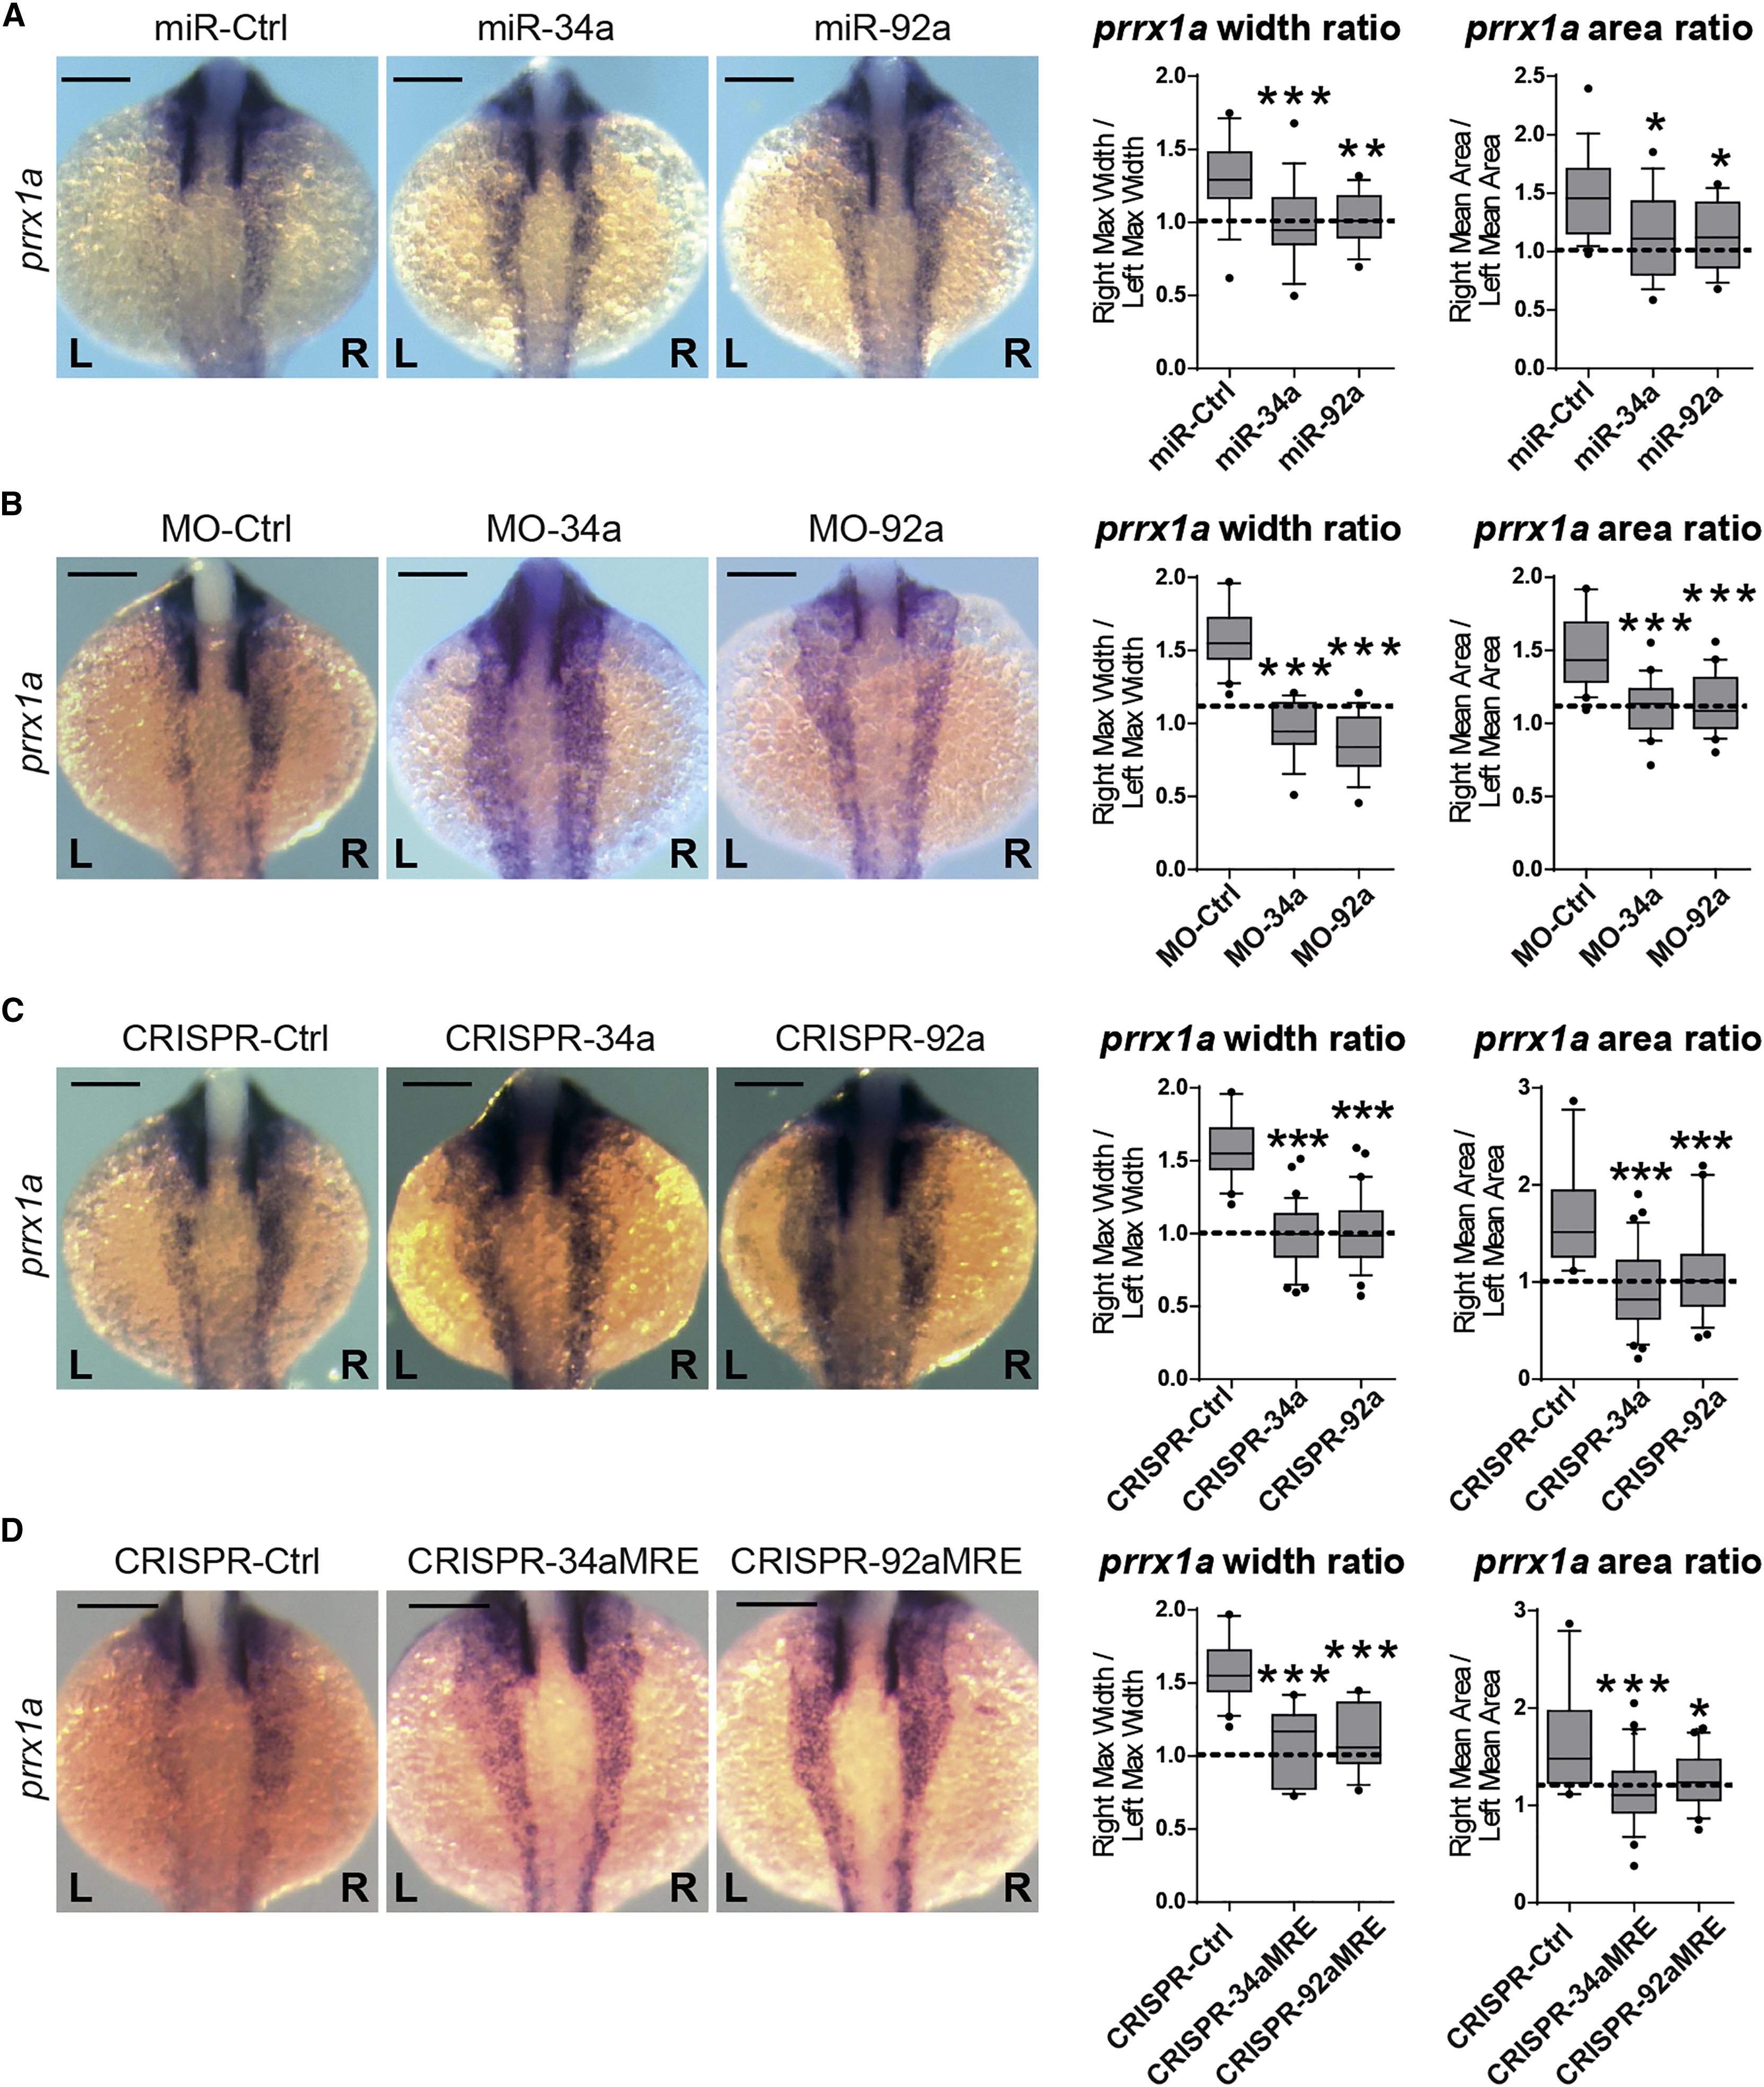
Fig. 2 miRNAs Regulate prrx1a Asymmetric Levels at the 20-Somite Stage Zebrafish embryos were injected with synthesized miRNAs, specific MOs, or sgRNAs targeting each miRNA sequence at 1- to 2-cell stage and collected at the 20-somite stage (A) miRNA gain-of-function analysis. Representative pictures of prrx1a expression in embryos injected with miR-135b-mut (miR-Ctrl), miR-34a or miR-92a. Quantification of width and area of prrx1a signal, represented as R/L ratio. A ratio of 1 (dotted line) indicates L/R bilateral symmetry. Data represent interquartile distribution with 10–90 percentile, ∗ p < 0.05, ∗∗ p < 0.01, ∗∗∗ p < 0.001, ANOVA with Dunnett’s multiple comparison test treatments versus miR-Ctrl, n = 16–19 embryos per condition. (B) miRNA downregulation analysis. Representative pictures of prrx1a expression in embryos injected with MO-Ctrl, or specific MOs for miR-34a (MO-34a) and miR-92a (MO-92a). Quantification of prrx1a signal width and area was performed as before. Data represent interquartile distribution with 10–90 percentile, ∗∗∗p < 0.001, ANOVA with Dunnett’s multiple comparison test treatments versus MO-Ctrl, n = 20 embryos per condition. (C) Representative pictures of prrx1a expression in embryos injected with Cas9 alone (CRISPR-Ctrl) or sgRNAs targeting either miR-34a (CRISPR-34a) or miR-92a (CRISPR-92a). The quantification of L/R areas and width were calculated as before. Data represent interquartile distribution with 10–90 percentile, ∗∗∗ p < 0.001, ANOVA with Dunnett’s multiple comparison test treatments versus CRISPR-Ctrl, n = 20–40 embryos per condition. (D) Zebrafish embryos were injected with sgRNAs targeting the predicted binding sites for miR-34a (CRISPR-34aMRE) or miR-92a (CRISPR-92aMRE) within the prrx1a 3′ UTR. Examples of the phenotypes observed at 20-somite stage, compared to a control (CRISPR-Ctrl; only Cas9 injected). Quantification of width and area of signal ratio of prrx1a in injected embryos. Data represent interquartile distribution with 10–90 percentile, ∗ p < 0.05, ∗∗∗ p < 0.001, ANOVA with Dunnett’s multiple comparison test CRISPR-MRE versus. CRISPR-Ctrl, n = 17–25 embryos per condition. Scale bar: 250 μm. See also Figure S2.
Reprinted from Developmental Cell, 51, Rago, L., Castroviejo, N., Fazilaty, H., Garcia-Asencio, F., Ocaña, O.H., Galcerán, J., Nieto, M.A., MicroRNAs Establish the Right-Handed Dominance of the Heart Laterality Pathway in Vertebrates, 446-459.e5, Copyright (2019) with permission from Elsevier. Full text @ Dev. Cell