
Fig. 1
- ID
- ZDB-IMAGE-200728-39
- Publication
- Troutwine et al., 2020 - The Reissner Fiber Is Highly Dynamic In Vivo and Controls Morphogenesis of the Spine
- All Figures
- Figures for Troutwine et al., 2020
|
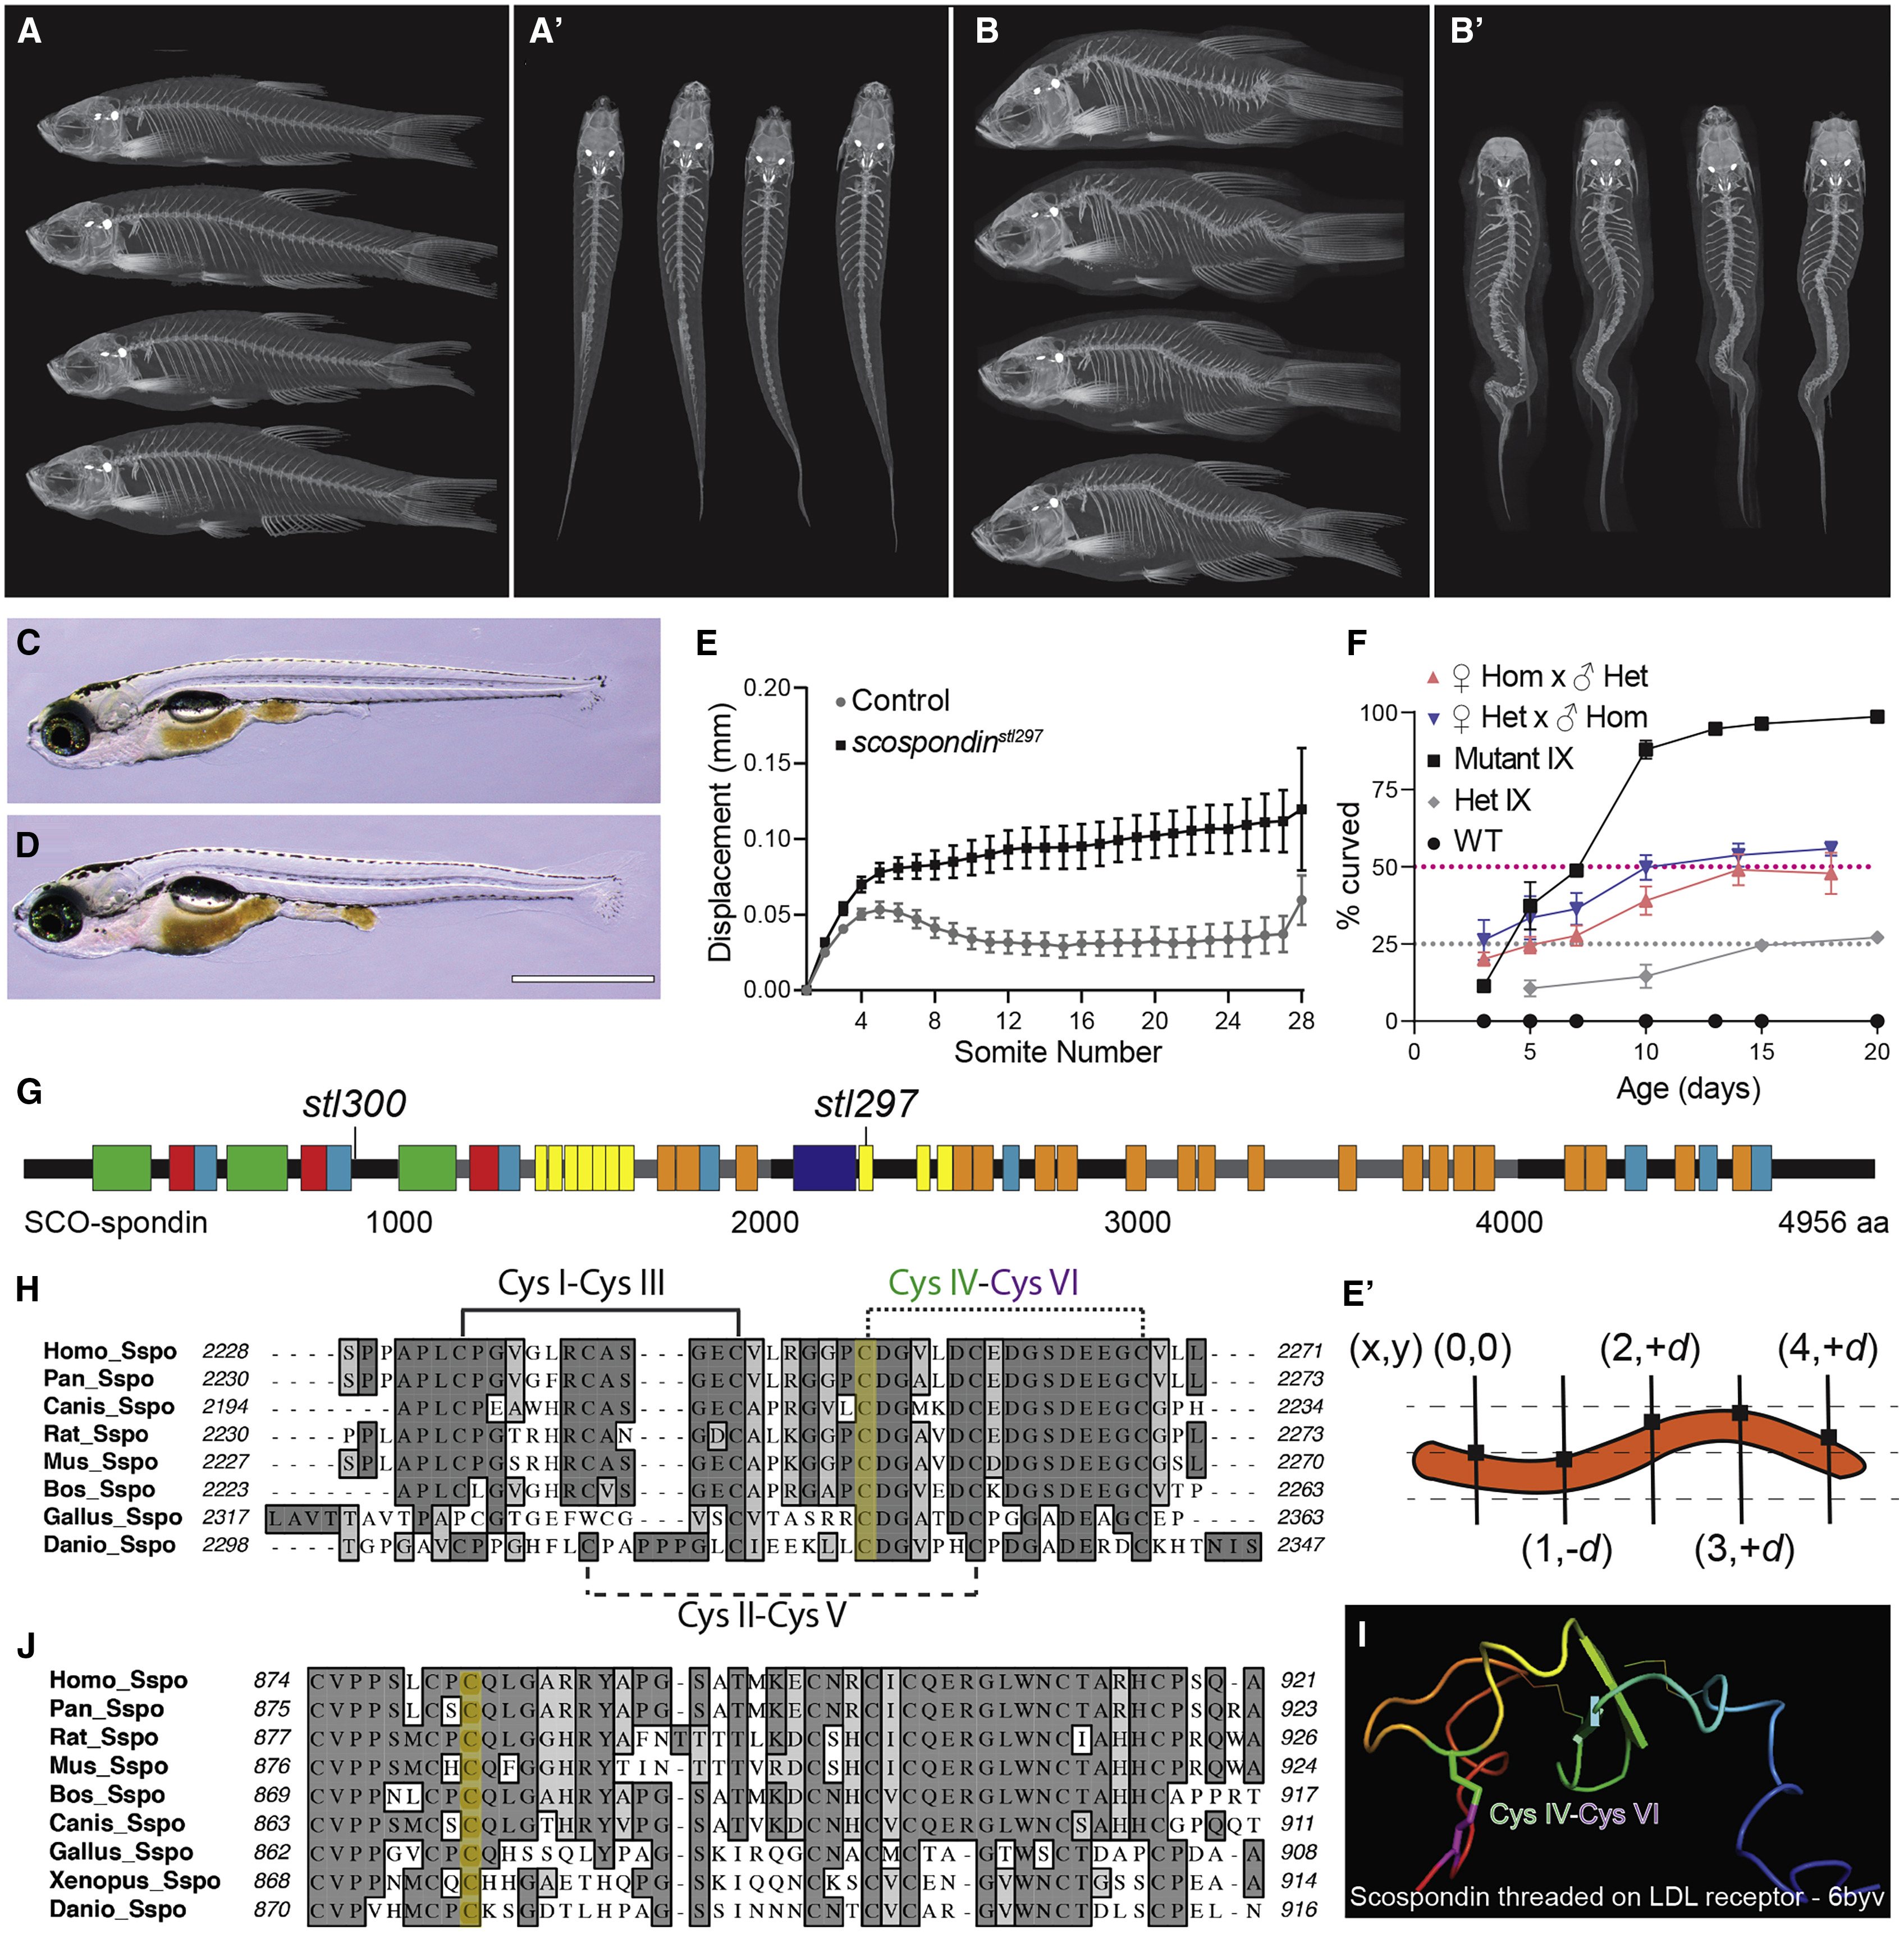
Fig. 1 Hypomorphic Mutations of Scospondin Lead to Progressive Scoliosis in Zebrafish (A–B’) MicroCT images of scospondinstl300/+ (A and A’) and scospondinstl300/stl300 mutant zebrafish (B and B’) at 90 dpf, in both lateral (A and B) and dorsal (A’ and B’) views showing adult-viable scoliosis. (C and D) Bright-field image of the typical straight body of a wild type (C) and atypical axial curvatures observed in homozygous scospondinstl297/stl297 mutant (D) larvae at 13 dpf. Scale bar, 1 mm. (E) Dorsal-ventral axis displacement of the notochord in 5-dpf heterozygous scospondinstl297/+ and scospondinstl297/stl297 mutants (mean + SEM, n = 10 and 23, respectively). (E’) Displacement is the absolute value of the dorsal-ventral (y axis) measured against an origin set at the intersection of the first somite boundary and the dorsal edge of the notochord and propagated along the entire axis at each somite boundary for each animal. (F) Incidence of axial curvatures over developmental time for wild type, MZscospondinstl297, and progeny from heterozygous scospondinstl297/+ × scospondinstl297/stl297 mutant crosses from both female and male homozygotes and progeny from heterozygous scospondinstl297/+ incrosses (mean + SEM; n = 112, 105, 116, 138, and 118 embryos, respectively, pooled from three independent clutches). (G) Schematic representation of zebrafish SCO-spondin protein, demarking the location of the scospondin alleles causing scoliosis in zebrafish reported in this study. Boxes represent conserved motifs; legend in Figure S1. (H and J) Protein alignments (Clustal-W) of SCO-spondin protein showing the sequence surrounding the amino acid residues (yellow highlight) affected by the scospondinstl297 (H) and the scospondinstl300 (J) mutations. (I) A homology model of Danio rerio SCO-spondin threaded onto the LDLrA domain derived from an LDL receptor structure (PDB: 6byv). The predicted disulfide bond and labeled cysteine (Cys) residues are highlighted in (H) and (I). See also Figures S1 and S2.