
|
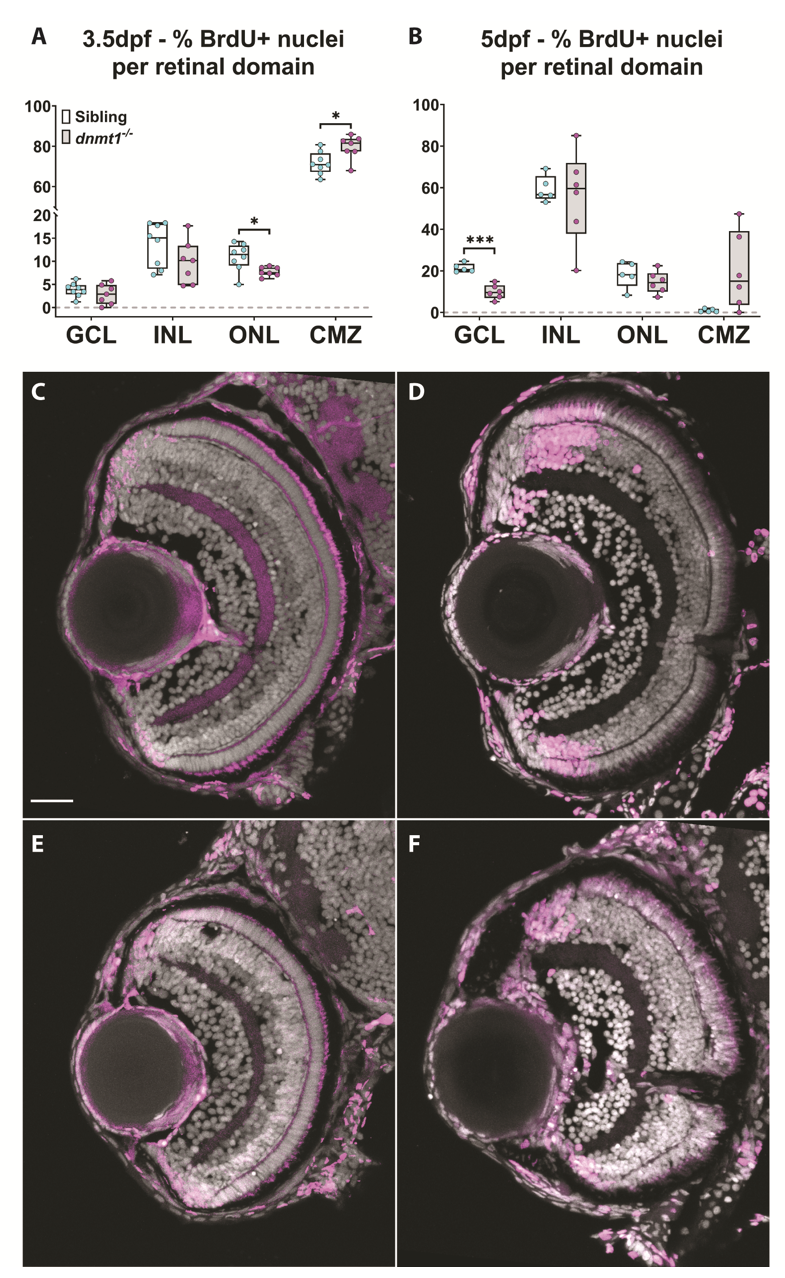
Figure S3
dnmt1-deficient RSCs fail to incorporate into the neural retina. A. Data points collected of the proportion of cells labeled with BrdU in each retinal domain at 3.5dpf divided by the number of total BrdU+ cells. B. Data points collected of the proportion of cells labeled with BrdU in each layer at 5dpf divided by the number of total BrdU+ cells. Sibling controls = white bars; dnmt1-/- = gray bars. *p <0.05, ***p <0.0005. C-F. Transverse sections of sibling (C-D) and dnmt1-/- (E-F) retinae at 3.5dpf (C,E) and 5dpf (D,F). Nuclei labeled with DAPI (gray). BrdU+ cells (magenta). Dorsal is up in all images. Scale bar (C) = 30 μm. All images taken at the same magnification.