Figure Caption
Figure 7
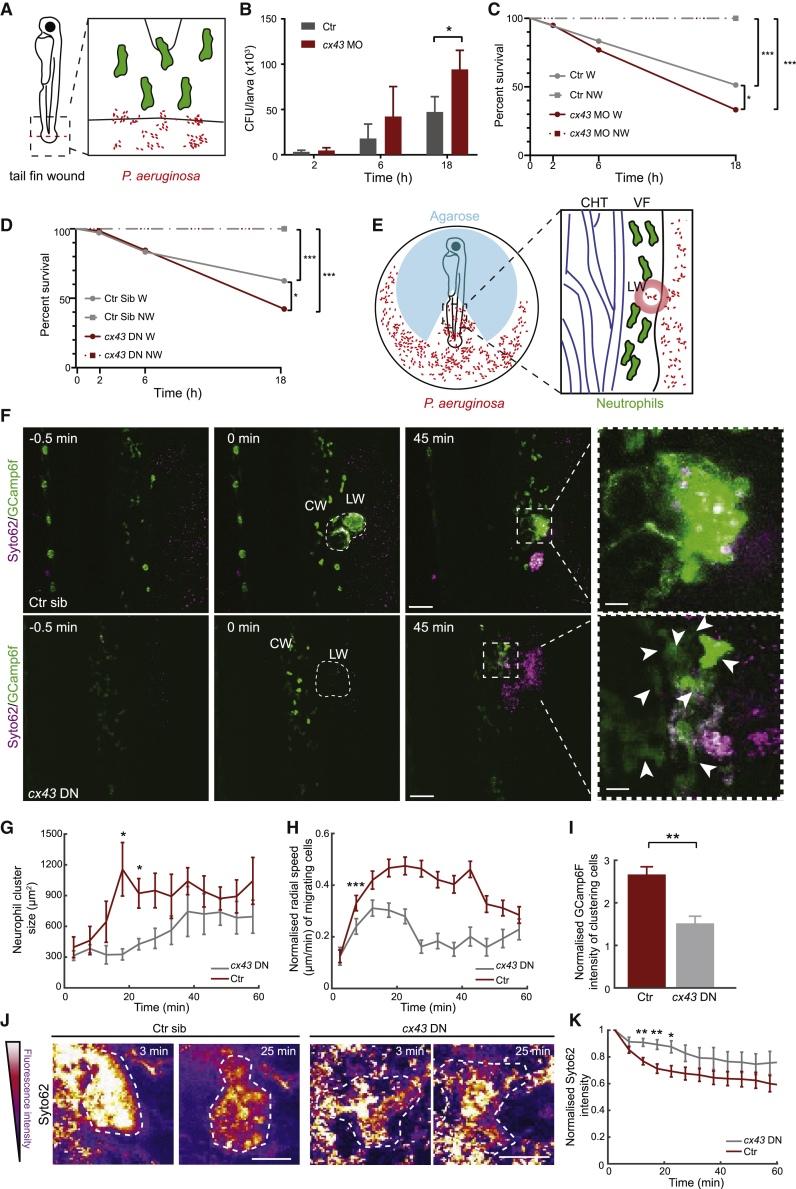
Cx43 Is Required for Maximal Wound Defense from Bacterial Invasion
(A) Schematic of tail amputation and infection by PAO1 P. aeruginosa.
(B) Colony-forming units (CFUs) per larva in control wild-type (AB strain), non-injected larvae or cx43 MO-injected larvae. Time after wounding is in hours (h). n = 4 experiments, with 5 larvae per group; Mann-Whitney test.
(C) Survival over time in control wild-type, non-injected larvae or cx43 MO-injected larvae, wounded (W) or not (NW) in the presence of PAO1. n = 4 experiments, with 20 larvae per group; log rank (Mantel-Cox) test.
(D) Survival over time in Tg(lyz:GCamp6F)xTg(lyz:cx43DN-T2A-mCherry) zebrafish larvae, positive (cx43 DN) or negative for the Cx43DN-T2A-mCherry transgene (control siblings: Ctr sib), wounded (W) or not (NW) in the presence of PAO1. n = 4 experiments, with 20 larvae per group; log rank (Mantel-Cox) test.
(E) Schematic of imaging wound infection. Annotations are as in Figure 4E.
(F) Time-lapse sequence of two-photon confocal projections showing neutrophils in zebrafish larvae, positive (cx43 DN) or negative for the Cx43DN-T2A-mCherry transgene (control siblings; Ctr sib), in the presence of Syto62-labeled PAO1. Scale bars represent 50 μm and 10 μm. CW, CHT, and VF are as in Figure 1C. Arrows indicate neutrophils in contact with the wound. Dotted lines outline neutrophil clusters.
(G) Neutrophil cluster size over time post-wounding in cx43 DN or control larvae (Ctr) (includes negative siblings and single Tg(lyz:GCamp6F) transgenics). n = 5 cx43 DN and 7 control larvae from 6 and 5 experiments, respectively; Mann-Whitney test.
(H) Neutrophil radial speed over time post-wounding in cx43 DN or control larvae. n = 1,290–1,537 cell steps per bin from 7 control larvae and n = 1,527–2,079 cell-steps per bin from 8 cx43 DN larvae imaged in 6 and 5 experiments, respectively; Mann-Whitney test.
(I) GCamp6F levels normalized as in Figure 1D. n = 5 cx43DN transgenics and n = 7 control larvae from 6 and 5 experiments, respectively; Mann-Whitney test.
(J) Images of the wound (dotted outline) pseudocolored for fluorescence intensity of Syto62-labeled PAO1 bacteria. Time post-wounding is indicated in minutes. Scale bar represents 25 μm.
(K) Fluorescence intensity of bacteria at the wound relative to maximal initial intensity in this area. n = 5 Cx43 DN and n = 8 control larvae from 6 and 5 experiments, respectively; Mann-Whitney test.
Error bars represent SEM. ∗p < 0.03, ∗∗p < 0.002, ∗∗∗p < 0.0002. See also Figure S7 and Video S7.
Acknowledgments
This image is the copyrighted work of the attributed author or publisher, and
ZFIN has permission only to display this image to its users.
Additional permissions should be obtained from the applicable author or publisher of the image.
Full text @ Curr. Biol.