
Figure 4
- ID
- ZDB-IMAGE-200725-5
- Publication
- Poplimont et al., 2020 - Neutrophil Swarming in Damaged Tissue Is Orchestrated by Connexins and Cooperative Calcium Alarm Signals
- All Figures
- Figures for Poplimont et al., 2020
|
Figure 4
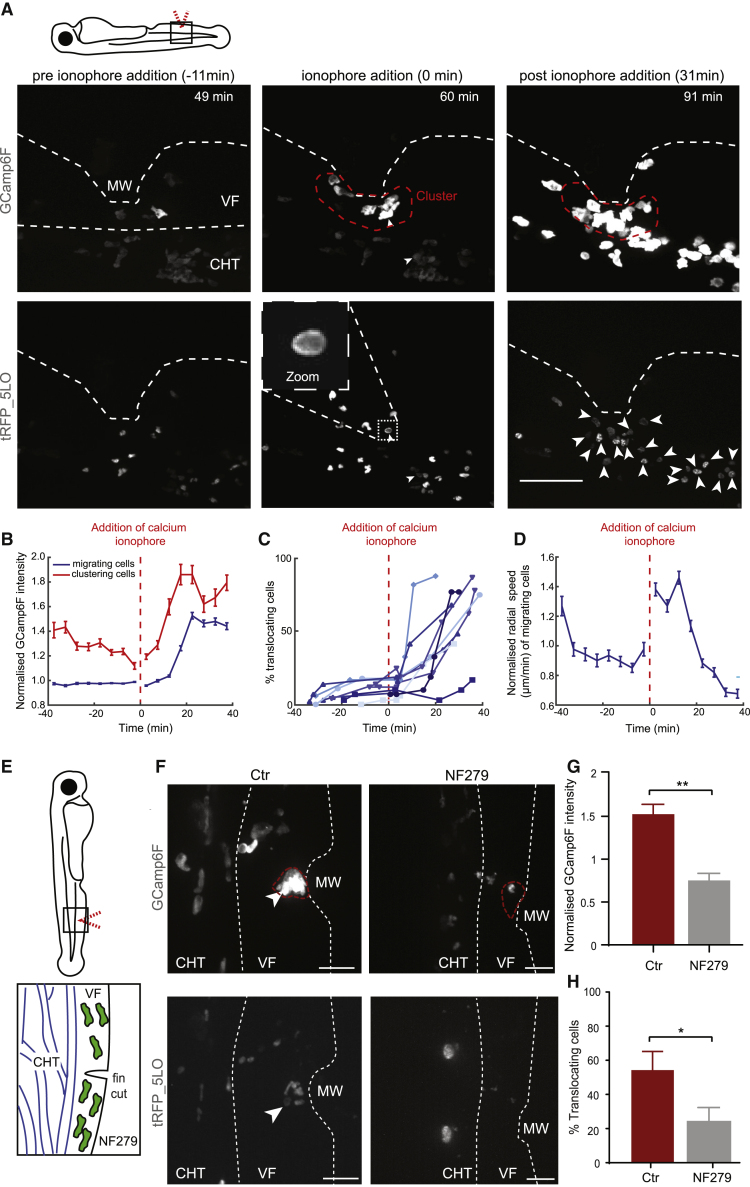
ATP-Gated Calcium Channels and Extracellular Calcium Entry Promote 5-LO-Capacitating Calcium Fluxes in Neutrophils
(A) Spinning-disk confocal projections from neutrophils in Tg(
(B) Normalized GCamp6F intensity over time in clustering versus migrating cells (cells within or beyond denoted red line in A). The time in relation to calcium ionophore addition is shown. n = 768–2,140 cells per bin (migrating) and n = 116–461 cells per bin (clustering) from 8 larvae in 3 experiments.
(C) Percentage of 5-LO-translocating neutrophils out of all neutrophils visible in the field of view. Each line represents an individual larva; 8 larvae from 3 different experiments.
(D) Normalized radial speed over time for migrating cells. n = 743–1,851 cells per bin from 8 larvae in 3 experiments.
(E) Schematic of mechanical ventral fin wounding in the presence of NF279. Blue indicates vessels of the caudal vein plexus within the caudal hematopoietic site.
(F) Spinning-disk confocal projection images of neutrophils in Tg(
(G) Mean normalized GCamp6F intensity larvae treated or not with NF279. GCamp6F intensity was normalized as in
(H) Percentage of translocating neutrophils out of all neutrophils recruited into the fin over 2 h. n = 7 control and n = 3 NF279-treated larvae from 3 and 2 experiments, respectively; Mann-Whitney test.
Error bars represent SEM. ∗p < 0.03, ∗∗p < 0.002. See also