
Figure 1
- ID
- ZDB-IMAGE-200725-2
- Publication
- Poplimont et al., 2020 - Neutrophil Swarming in Damaged Tissue Is Orchestrated by Connexins and Cooperative Calcium Alarm Signals
- All Figures
- Figures for Poplimont et al., 2020
|
Figure 1
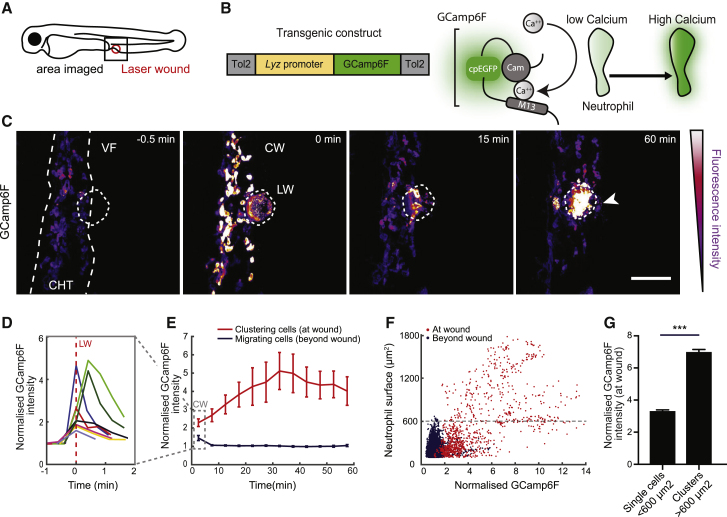
Calcium Dynamics in Neutrophils during Swarming
(A) Schematic of a 3-day-post-fertilization (dpf) zebrafish larva showing the area of two-photon laser wound damage and imaging.
(B) Construct expressing GCamp6F under the control of the lysozyme C promoter (
(C) Time-lapse sequence of two-photon confocal image projections showing neutrophils (color-coded for GCamp6F intensity) migrating from the caudal hematopoietic tissue (CHT) toward a laser wound (LW) (dotted line) at the ventral fin-CHT boundary (VF/CHT) in a Tg(
(D) Quantification of mean GCamp6F intensity over time in all neutrophils in the field of view in the first 2 min post-wound. Intensity values were normalized to the mean intensity of segmented neutrophils prior to wound. Each line represents mean intensity per experimental larva.
(E) Quantification of GCamp6F intensity over time in neutrophils clustering at the wound versus migrating neutrophils beyond the wound (dotted line in C). Intensity values were normalized as in (D). n = 8 larvae in 8 experiments. Dotted square denotes the time-bin corresponding to analysis in (D).
(F) Normalized GCamp6F intensity in relation to the surface area of segmented neutrophils. Individual dots represent single neutrophils or clustered neutrophils at the wound (red) or migrating cells beyond the wound (blue). The maximum surface area for single neutrophils is indicated with dotted line. Data are from 8 larvae in 8 experiments.
(G) Comparison of GCamp6F intensity in single (<600 μm2) versus clustering neutrophils (>600 μm2). n = 924 single cells and n = 347 clustered cells from 8 larvae in 8 experiments; Mann-Whitney test.
In all panels, error bars represent SEM. ∗∗∗p < 0.0002. See also