
|
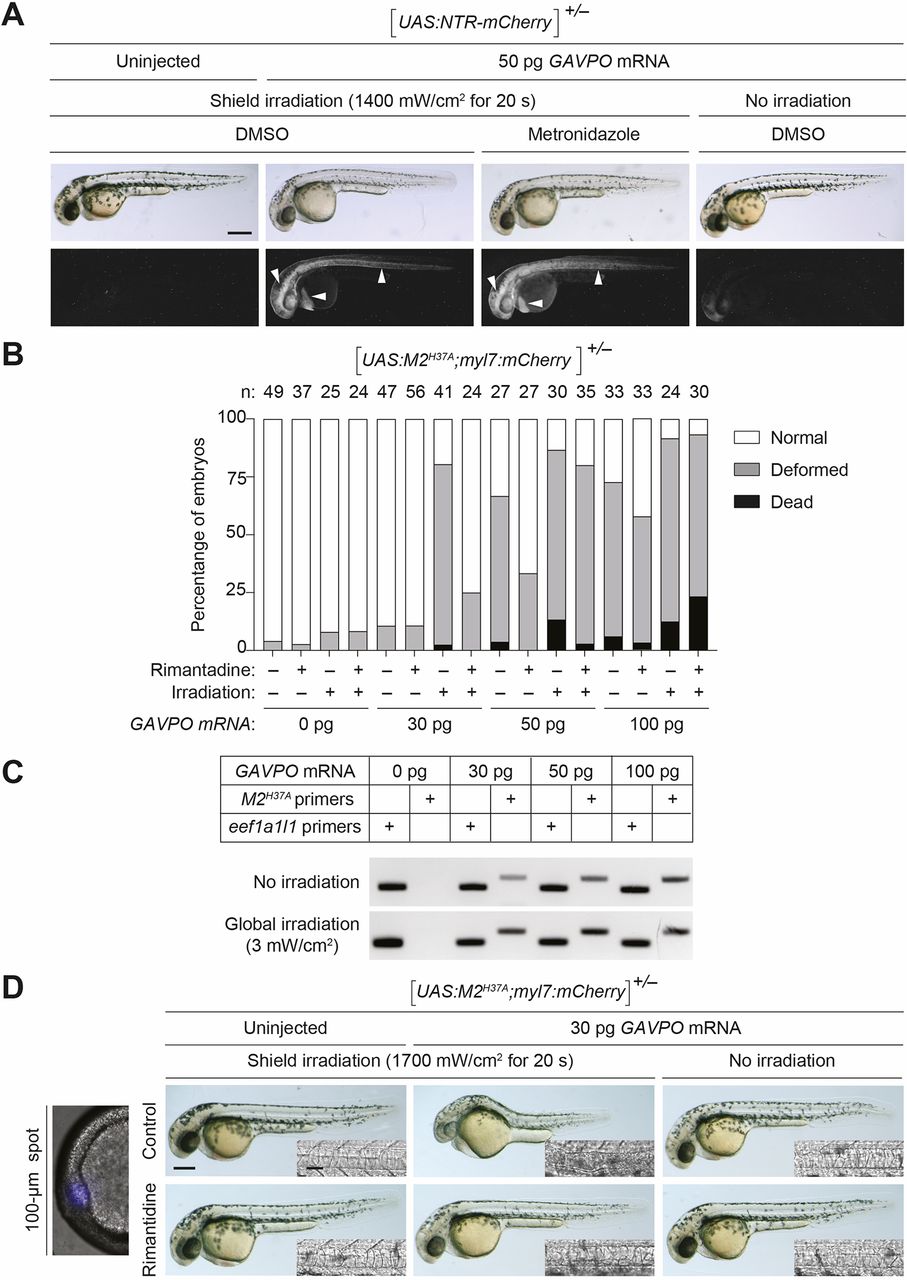
Fig. 3
GAVPO-mediated toxicity in UAS:NTR-mCherry and UAS:M2H37A zebrafish lines. (A) Tg(UAS:NTR-mCherry) zygotes were injected with the designated amounts of GAVPO mRNA, and their embryonic shields were irradiated at 6 hpf using an epifluorescence microscope equipped with a 470/40 nm filter. An iris diaphragm was used to restrict illumination to a 100 µm diameter region. The 10 hpf embryos were dechorionated and treated with DMSO or 5 mM metronidazole, and imaged at 32 hpf. Representative bright-field and epifluorescence micrographs from two independent experiments are shown. Shield-irradiation of the GAVPO-expressing embryos induces NTR-mCherry expression in the notochord, head mesoderm and hatching gland (arrowheads). (B) The designated amounts of GAVPO mRNA were injected into Tg(UAS:UAS:M2H37A; myl7:mCherry) zygotes, and the embryos were either cultured in the dark or globally exposed to blue LED light (3 mW/cm2) from 6 to 8 hpf and then cultured in the absence or presence of 100 μg/ml rimantadine. Developmental phenotypes were scored at 24 hpf, using the indicated number of embryos (n) per condition from two to four independent experiments. Statistical analyses: χ2=301, d.f.=30, P<0.00001. (C) RT-PCR analyses of M2H37A expression in Tg(UAS:UAS:M2H37A;myl7:mCherry) embryos injected with GAVPOmRNA and treated as described above. The expression of the translation elongation factor eef1a1l1 was used as a normalization control. The amplification reaction was performed using a standard PCR with 40 cycles for M2 and 35 cycles for eef1a1l1 amplification. (D) Tg(UAS:M2H37A;myl7:mCherry) zygotes were injected with the designated amounts of GAVPO mRNA, cultured in the absence or presence of 100 µg/ml rimantadine, shield-irradiated at 6 hpf as described in A, and imaged at 30 hpf. Representative bright-field and differential interference contrast (DIC) micrographs from three independent experiments are shown. Shield irradiation of the GAVPO-expressing embryos disrupts development of the notochord (inset), head and hatching gland. All embryos are shown in lateral view, anterior left. Scale bars: 250 µm in A,D; 50 µm in D (insets). Statistics for the observed phenotypes are in Table S3.