
|
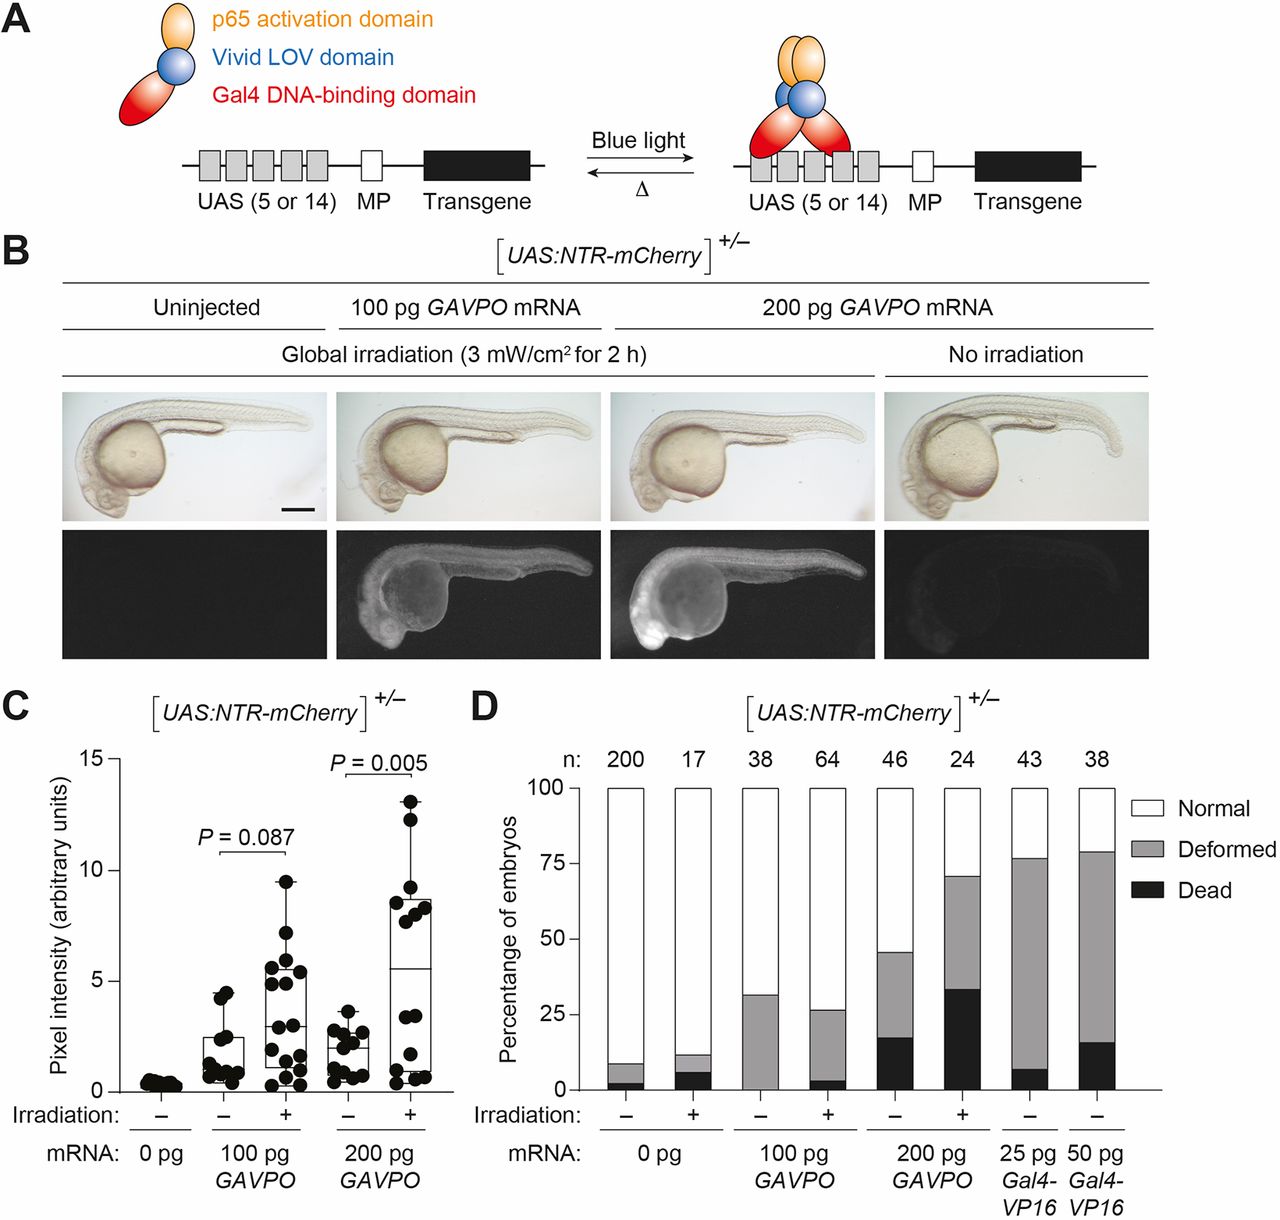
Fig. 2
GAVPO conveys light-inducible gene expression in zebrafish. (A) Mechanism of GAVPO-dependent transcription of a transgene with an upstream activating sequence (UAS) and minimal promoter (MP). (B) Tg(UAS:NTR-mCherry) zygotes were injected with the designated amounts of GAVPO mRNA, irradiated with a blue LED lamp at 6 hpf, and then imaged at 24 hpf. Representative bright-field and epifluorescence micrographs from two to four independent experiments are shown. GAVPO induces NTR-mCherry expression in a light- and concentration-dependent manner. Scale bar: 250 µm. (C) Quantification of mCherry fluorescence in Tg(UAS:NTR-mCherry)zygotes were injected with the designated amounts of GAVPOmRNA, as described in B. The box extends from the 25th to 75th percentiles. The whiskers extend to the minimum and maximum values. The horizontal line indicates the average value. (D) The designated amounts of GAVPO or Gal4VP16 mRNA were injected into Tg(UAS:NTR-mCherry) zygotes, and the embryos were either cultured in the dark or globally exposed to blue LED light (3 mW/cm2) from 6 to 8 hpf. Developmental phenotypes were then scored at 24 hpf, using the indicated number of embryos (n) per condition from two to four independent experiments. Statistical analyses: χ2=190, d.f.=14, P<0.00001. Statistics for the observed phenotypes are in Table S2.