IMAGE

FIGURE 6

ID
ZDB-IMAGE-200718-14
Source
Figures for Chen et al., 2020
Image
Figure Caption

FIGURE 6

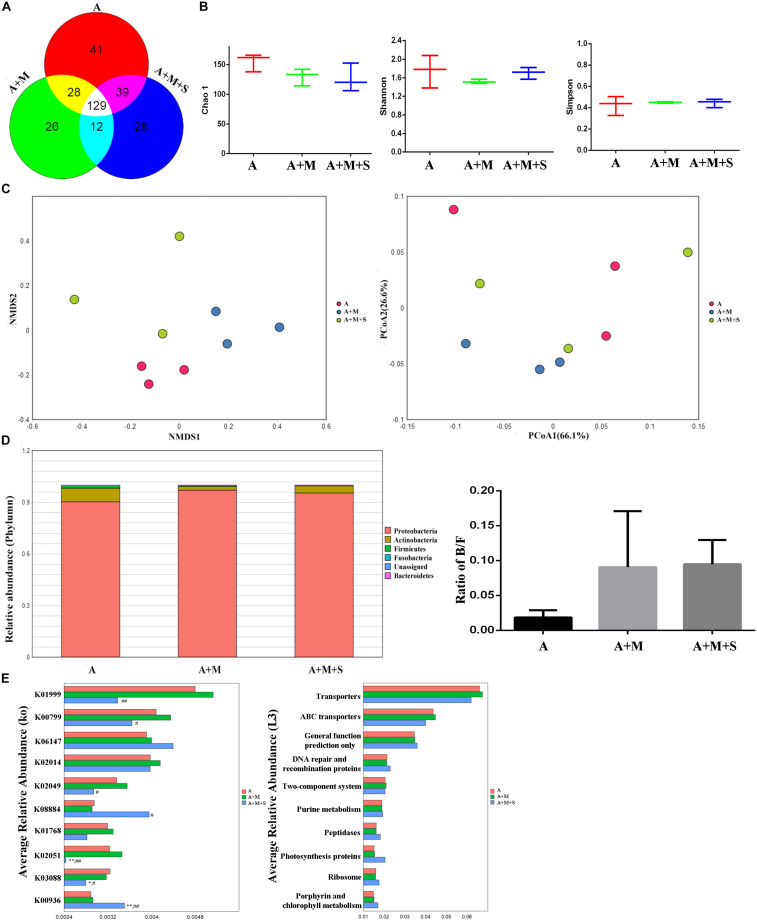
Effect of antibiotic use on the sinomenine treatment of the morphine-dependent gut microbiome. (A) Venn diagram depicting the distribution of bacterial taxa (at the OTU level) in the different experimental groups of zebrafish. (B) Alpha diversity of the fecal microbiome among the three groups according to the Chao 1, Richness, Shannon, and Simpson indices. (C) Beta diversity of the fecal microbiome among the three groups based on principal coordinate analysis (PCoA) and nonmetric multidimensional scaling (NMDS) at the OTU level based on the Bray–Curtis similarity algorithms. (D) Comparison of species composition among the fecal microbiota of the A, A+M, and A+M+S groups at the phylum level. (E) Prediction of changes in KEGG pathways using PICRUST analysis. *P < 0.05, **P < 0.01 vs the A group; #P < 0.05, ##P < 0.01 vs the A+M group. A, antibiotic group; A+M, antibiotic+morphine group; A+M+S, antibiotic+morphine+sinomenine group.

Acknowledgments
This image is the copyrighted work of the attributed author or publisher, and ZFIN has permission only to display this image to its users. Additional permissions should be obtained from the applicable author or publisher of the image. Full text @ Front Microbiol