
Figure 5
- ID
- ZDB-IMAGE-200711-7
- Publication
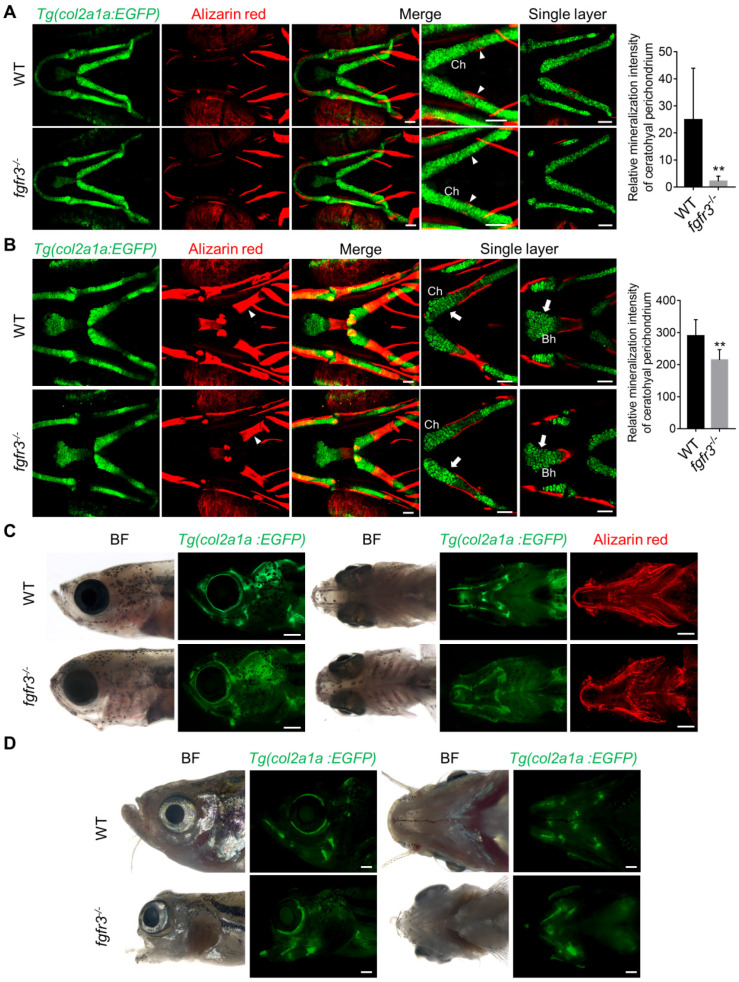
- Sun et al., 2020 - Fgfr3 mutation disrupts chondrogenesis and bone ossification in zebrafish model mimicking CATSHL syndrome partially via enhanced Wnt/β-catenin signaling
- All Figures
- Figures for Sun et al., 2020
|
Figure 5