
IMAGE
Figure 8
- ID
- ZDB-IMAGE-200711-10
- Publication
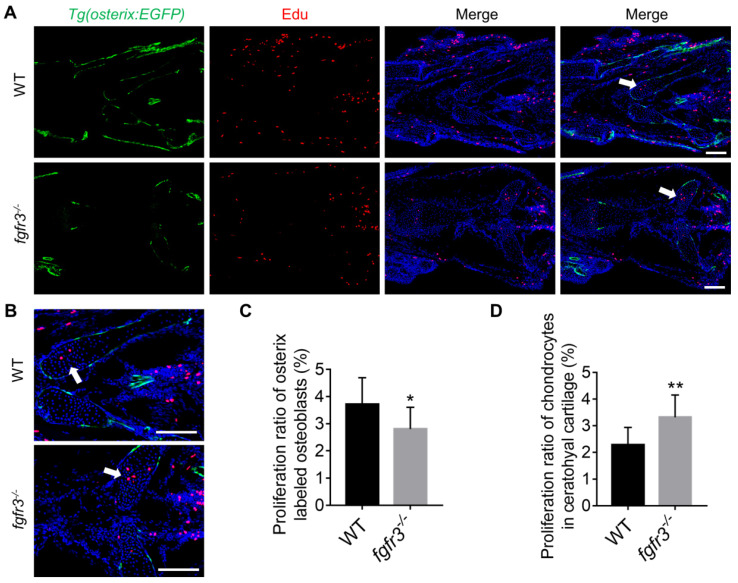
- Sun et al., 2020 - Fgfr3 mutation disrupts chondrogenesis and bone ossification in zebrafish model mimicking CATSHL syndrome partially via enhanced Wnt/β-catenin signaling
- All Figures
- Figures for Sun et al., 2020
Image
|
Figure Caption
Figure 8
Figure Data
Acknowledgments
This image is the copyrighted work of the attributed author or publisher, and
ZFIN has permission only to display this image to its users.
Additional permissions should be obtained from the applicable author or publisher of the image.
Full text @ Theranostics