
IMAGE
Figure 1
- ID
- ZDB-IMAGE-200704-1
- Publication
- Zarantoniello et al., 2020 - Zebrafish (Danio rerio) physiological and behavioural responses to insect-based diets: a multidisciplinary approach
- All Figures
- Figures for Zarantoniello et al., 2020
Image
|
Figure Caption
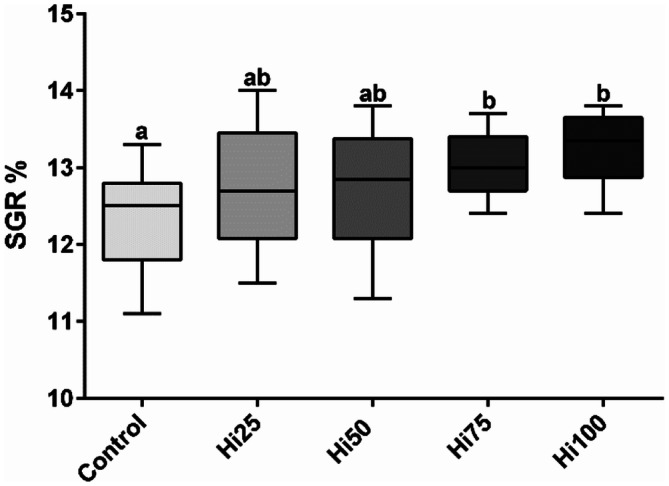
Figure 1
Zebrafish fed experimental diets specific growth rate (% weight growth day−1). Zebrafish fed diets including 0, 25, 50, 75 and 100% of BSF meal (Control, Hi25, Hi50, Hi75 and Hi100, respectively). Boxplots show minimum and maximum (whiskers), first quartile, median and third quartile (box). Different letters indicate statistically significant differences among experimental groups (
Acknowledgments
This image is the copyrighted work of the attributed author or publisher, and
ZFIN has permission only to display this image to its users.
Additional permissions should be obtained from the applicable author or publisher of the image.
Full text @ Sci. Rep.