
Image
|
Figure Caption
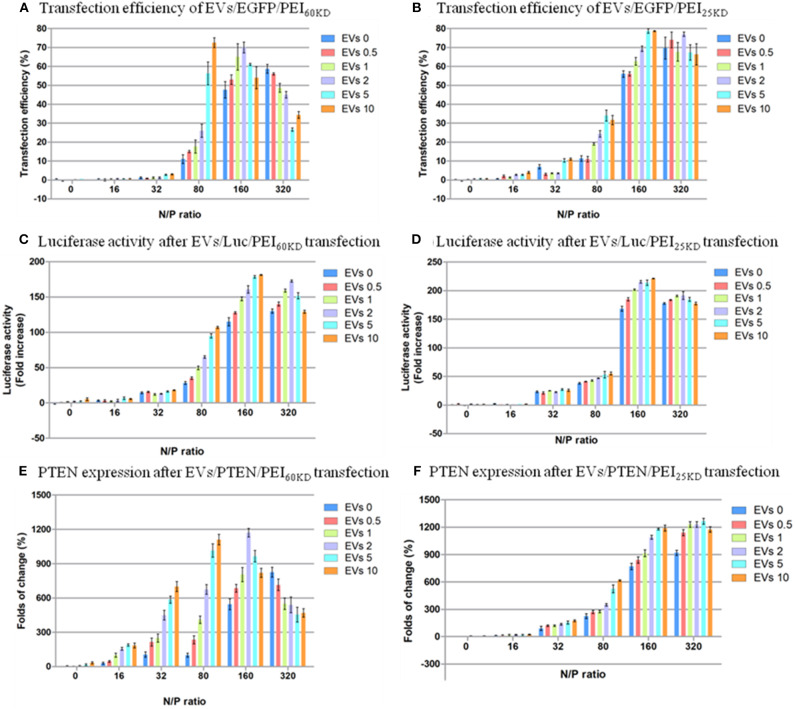
Figure 5
Transfection efficiency of HEK293T cells by plasmid EGFP using
Acknowledgments
This image is the copyrighted work of the attributed author or publisher, and
ZFIN has permission only to display this image to its users.
Additional permissions should be obtained from the applicable author or publisher of the image.
Full text @ Front Bioeng Biotechnol