IMAGE

Figure 2

ID
ZDB-IMAGE-200629-6
Source
Figures for Golla et al., 2020
Image
Figure Caption

Figure 2

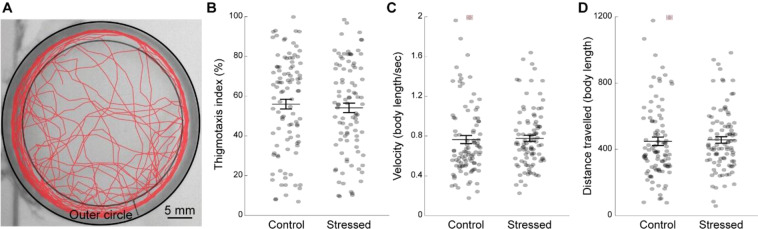
CUS exposure does not affect anxiety-like behaviors two days post-CUS in the open field test. (A) Representative swimming trajectory of a fish (in red) during the open field test lasting for ten minutes. The outer circle is indicated by two concentric black circles. (B) Thigmotaxis index that corresponds to the percentage of time spent in the outer circle. (C) Average swimming velocity in body length/second. The dot signaled by a red square was out of range (value = 2.78). (D) Total distance travelled for ten minutes in body length. The dot signaled by a red square was out of range (value = 1669). Each dot represents one fish (control: n = 99 fish; stressed: n = 94 fish). Data are represented as mean ± SEM.

Acknowledgments
This image is the copyrighted work of the attributed author or publisher, and ZFIN has permission only to display this image to its users. Additional permissions should be obtained from the applicable author or publisher of the image. Full text @ Sci. Rep.