IMAGE

Fig. 5

ID
ZDB-IMAGE-200619-46
Source
Figures for Sun et al., 2020
Image
Figure Caption

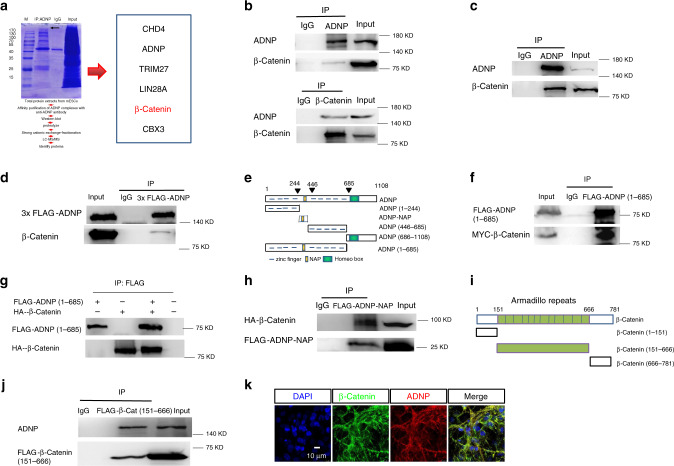
Fig. 5 Identifying β-catenin as an ADNP interacting protein.

a Schematic representation showing the experimental design of IP in combination mass spectrometry assay (left) and a list of representative ADNP interacting proteins (right). b Co-IP data for endogenous ADNP and β-catenin in ESCs. Up: IP ADNP followed by WB β-catenin; bottom: IP β-catenin followed by WB ADNP. c Co-IP data for endogenous ADNP and β-catenin of day 3 ESC-derived neurospheres. d Co-IP data for FLAG-ADNP and β-catenin in 3×FLAG-ADNP overexpressing Adnp−/− ESCs. e Schematic representation of the full-length and the truncated ADNP mutants. f IP of FLAG-ADNP-Nter (1–685) and Myc-β-catenin in HEK293T cells. g IP of in vitro synthesized HA-β-catenin and FLAG-ADNP. h Co-IP of FLAG-ADNP-NAP and HA-β-catenin in HEK293T cells. i Schematic representation of the full-length and the truncated β-catenin mutants. j Co-IP of FLAG-β-catenin (151–666) and ADNP in HEK293T cells. k Co-localization of ADNP and β-catenin in day 19 ESC-derived neuronal cell cultures. All WB and IF experiments were repeated at least two times. Similar results were obtained and shown are the representative images.

Acknowledgments
This image is the copyrighted work of the attributed author or publisher, and ZFIN has permission only to display this image to its users. Additional permissions should be obtained from the applicable author or publisher of the image. Full text @ Nat. Commun.