
Fig. 4
- ID
- ZDB-IMAGE-200619-33
- Publication
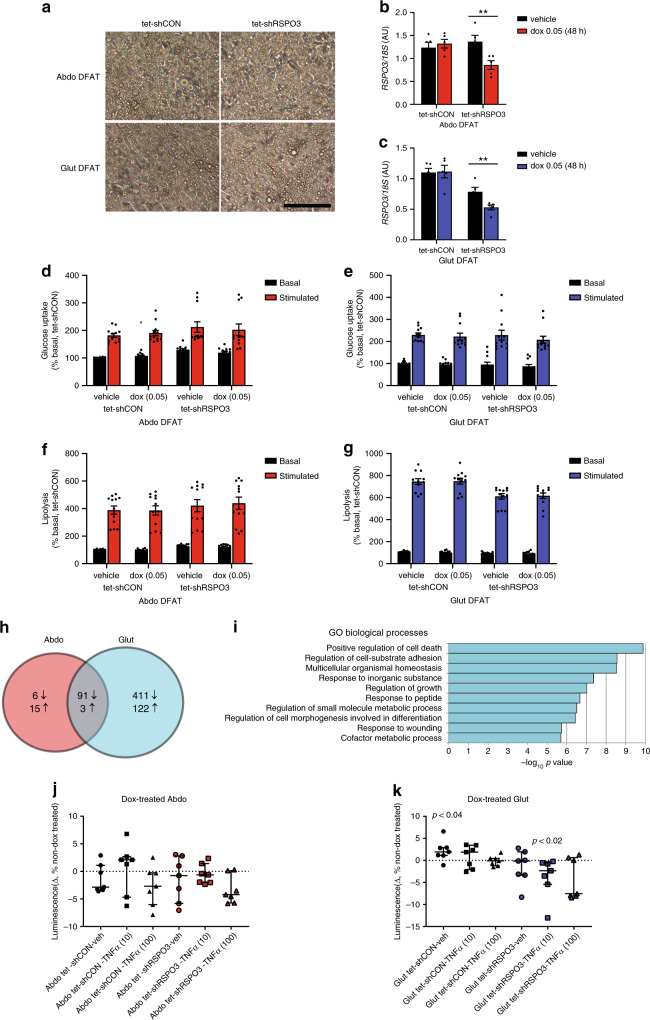
- Loh et al., 2020 - RSPO3 impacts body fat distribution and regulates adipose cell biology in vitro
- All Figures
- Figures for Loh et al., 2020
|
Fig. 4