
Fig. 1
- ID
- ZDB-IMAGE-200619-22
- Publication
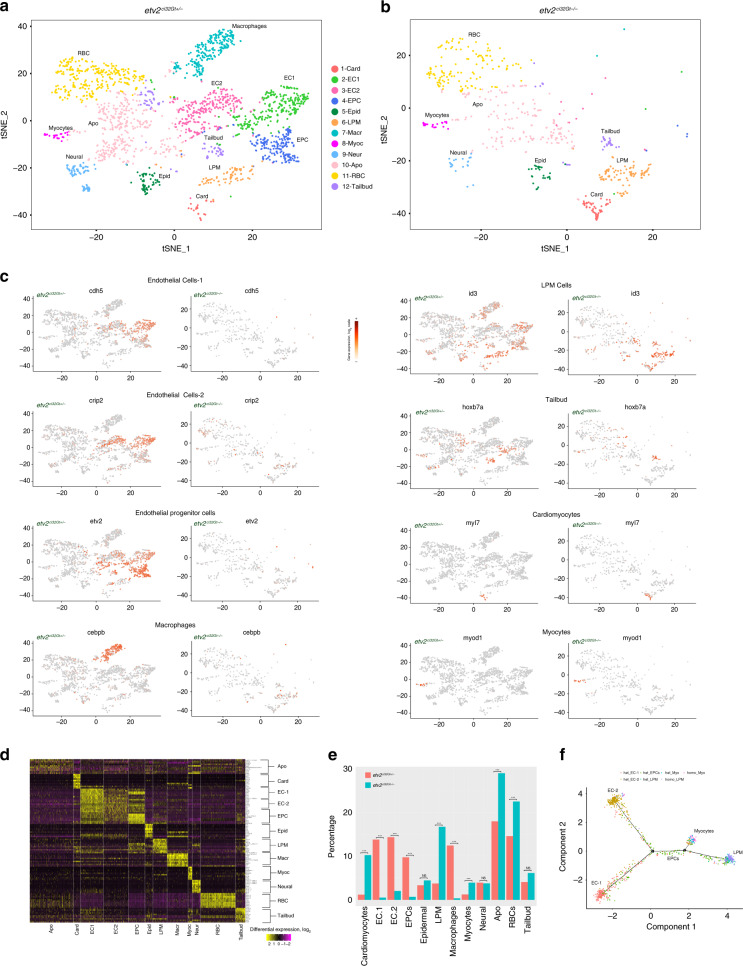
- Chestnut et al., 2020 - Single-cell transcriptomic analysis identifies the conversion of zebrafish Etv2-deficient vascular progenitors into skeletal muscle
- All Figures
- Figures for Chestnut et al., 2020
|
Fig. 1