
Image
|
Figure Caption
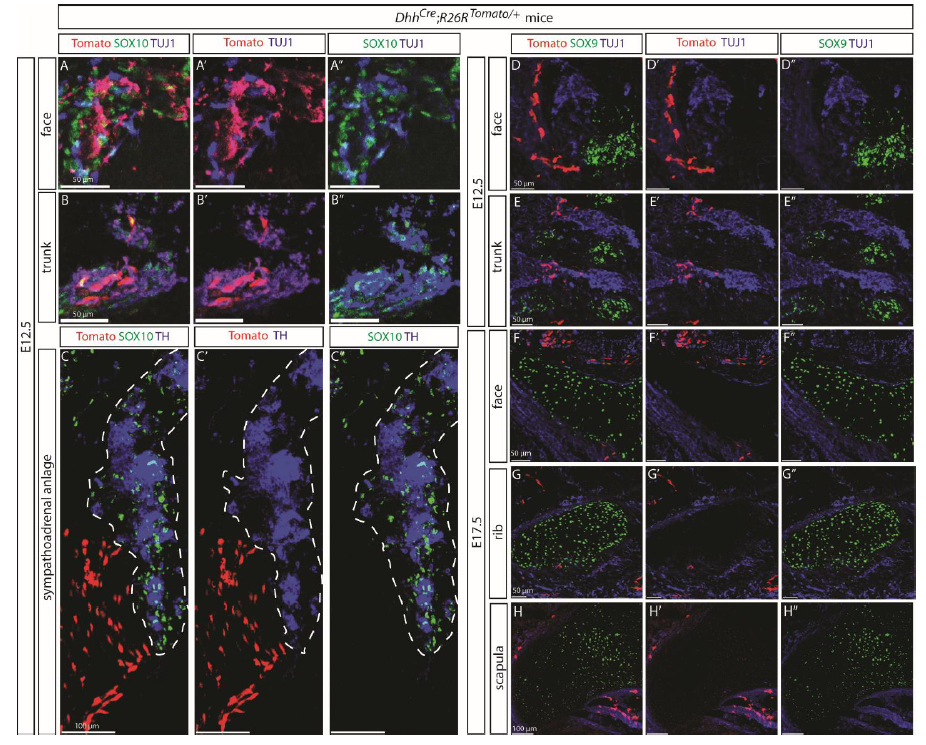
Fig. s6 DhhCre;R26RTomato/+ tracing analysis DhhCre;R26RTomato/+ visualized cells only partially overlap with SOX10+ population of SCPs along TUJ1- posotive cells at E12.5 (A-B) and do not contribute to sympathoadrenal anlage visualized by tyrosine hydroxylase (TH) staining at E12.5 (C). The white dashed lines outline the structure of synpathoadrenal anlage. (D-H) DhhCre;R26RTomato/+ traced cells did not contribute to chondrogenesis either at E12.5 (D-E) or E17.5 (G-H).
Acknowledgments
This image is the copyrighted work of the attributed author or publisher, and
ZFIN has permission only to display this image to its users.
Additional permissions should be obtained from the applicable author or publisher of the image.
Full text @ Proc. Natl. Acad. Sci. USA