
Fig. 7
- ID
- ZDB-IMAGE-200618-19
- Antibodies
- Publication
- Hehr et al., 2018 - Polarity and morphogenesis of the eye epithelium requires the adhesion junction associated adaptor protein Traf4
- All Figures
- Figures for Hehr et al., 2018
|
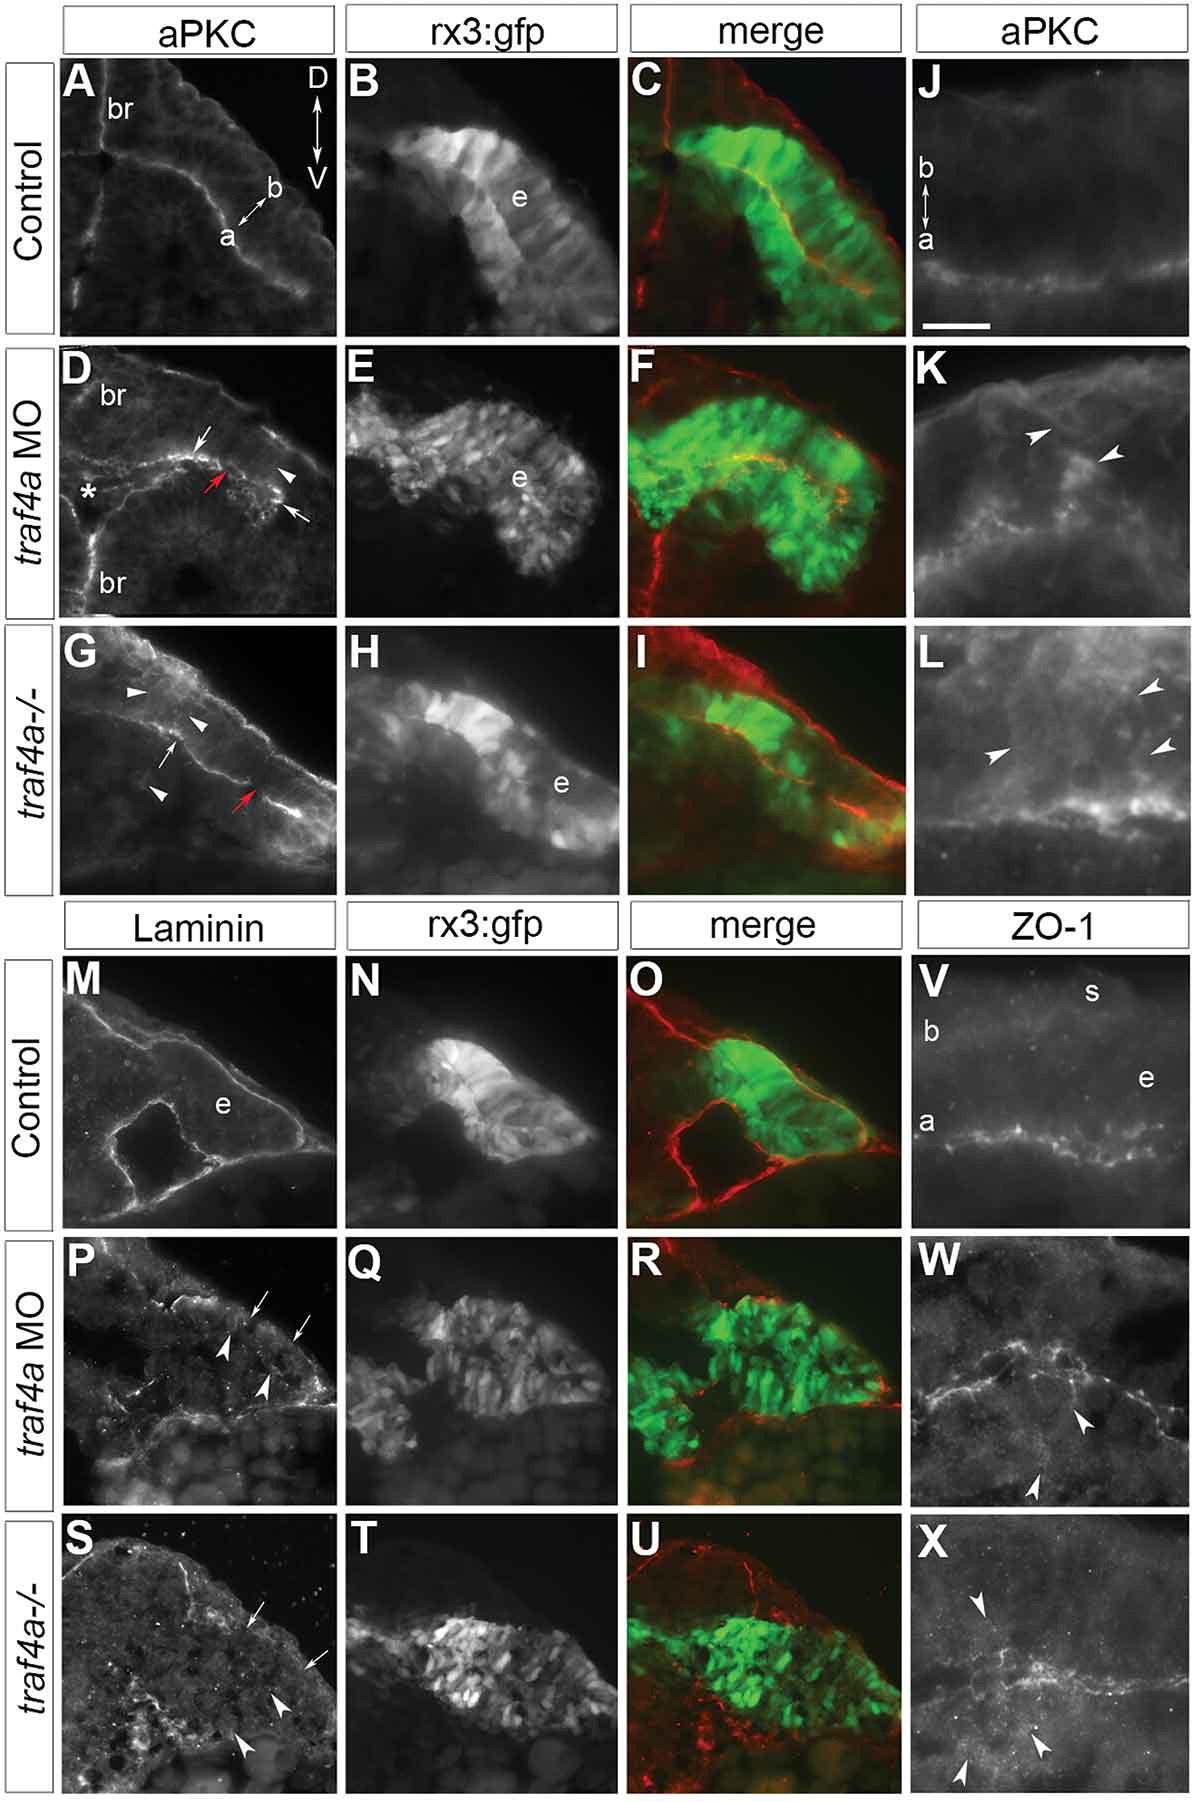
Fig. 7 Traf4a loss disrupts apical-basal polarity of the eye epithelium. Transverse sections through the anterior forebrain (br) and eye vesicles (e) of control (A-C,J,M-O,V), traf4a morphant (D-F,K,P-R,W), and traf4a-/- (G-I,L,S-U,X) 12-14ss Tg(rx3:GFP) embryos. A-L: aPKC (A,D,G,J-L) immunolabeling, and merge (C,F,I) with GFP (B,E,H). Unevenly distributed apical (D,G arrows), and patches of non-apically localized (D,G,K,L; arrowheads), aPKC immunolabel are evident with Traf4a loss. M-U: Laminin immunolabeling (M,P,S) is basally localized in control, but patchy (arrows) and occasionally ectopically expressed (arrowheads) in morphants and mutants. V-X: ZO-1 immunolabeling is predominantly at the apical surface of the eye epithelium, but is also ectopic to the apical surface (W,X; arrowheads) with Traf4a loss. Orientation in A applies to all panels. a, apical; b, basal; s, skin. Scale bar in J is 50 µm (A-I), 75 µm (M-U), and 20 µm (J-L, V-X).