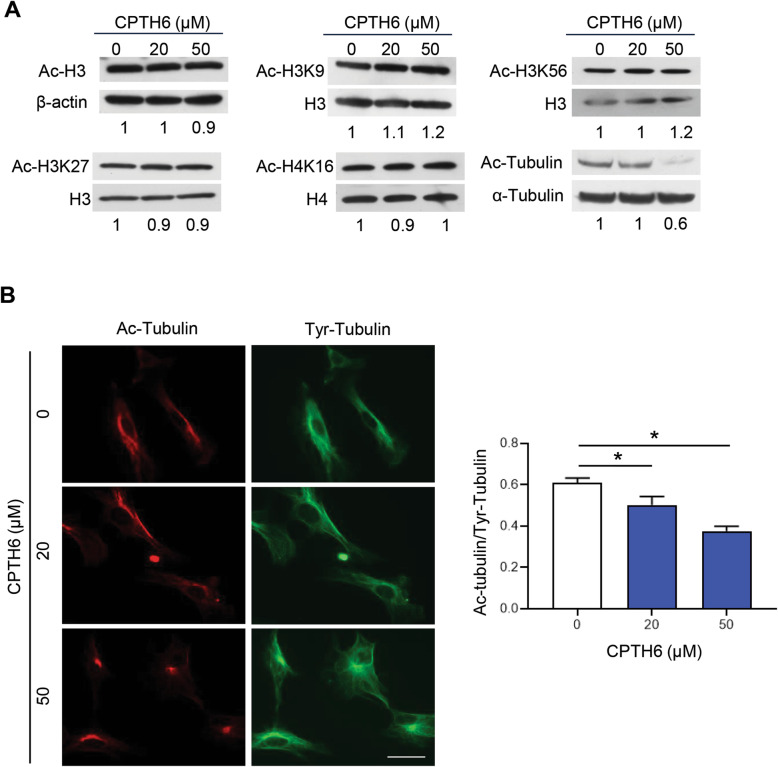
a Western blot analysis and relative quantification by densitometric analysis of total or acetylated histone H3 pan (Ac-H3) or at K9 (Ac-H3K9), K27 (Ac-H3K27), K56 (Ac-H3K56), and histone H4 at K16 (Ac-H4K16) and α-tubulin at K40 (Ac-tubulin) in extract of HUVEC exposed to indicated concentrations of CPTH6 for 72 h. Values are expressed as fold change of acetylated proteins relative to total ones. b Immunofluorescence images (left) and relative quantification (right) of tyrosinated (Tyr) and acetylated (Ac) α-tubulin in HUVEC exposed to increasing concentrations of CPTH6 for 72 h. p-values were calculated between control and treated cells. *p < 0.05. Magnification 63X. Scale bar, 50μm
Acknowledgments
This image is the copyrighted work of the attributed author or publisher, and
ZFIN has permission only to display this image to its users.
Additional permissions should be obtained from the applicable author or publisher of the image.
Full text @ J. Exp. Clin. Cancer Res.
Your Input Welcome
Thank you for submitting comments. Your input has been emailed to ZFIN curators who may contact you if
additional information is required.
Oops. Something went wrong. Please try again later.