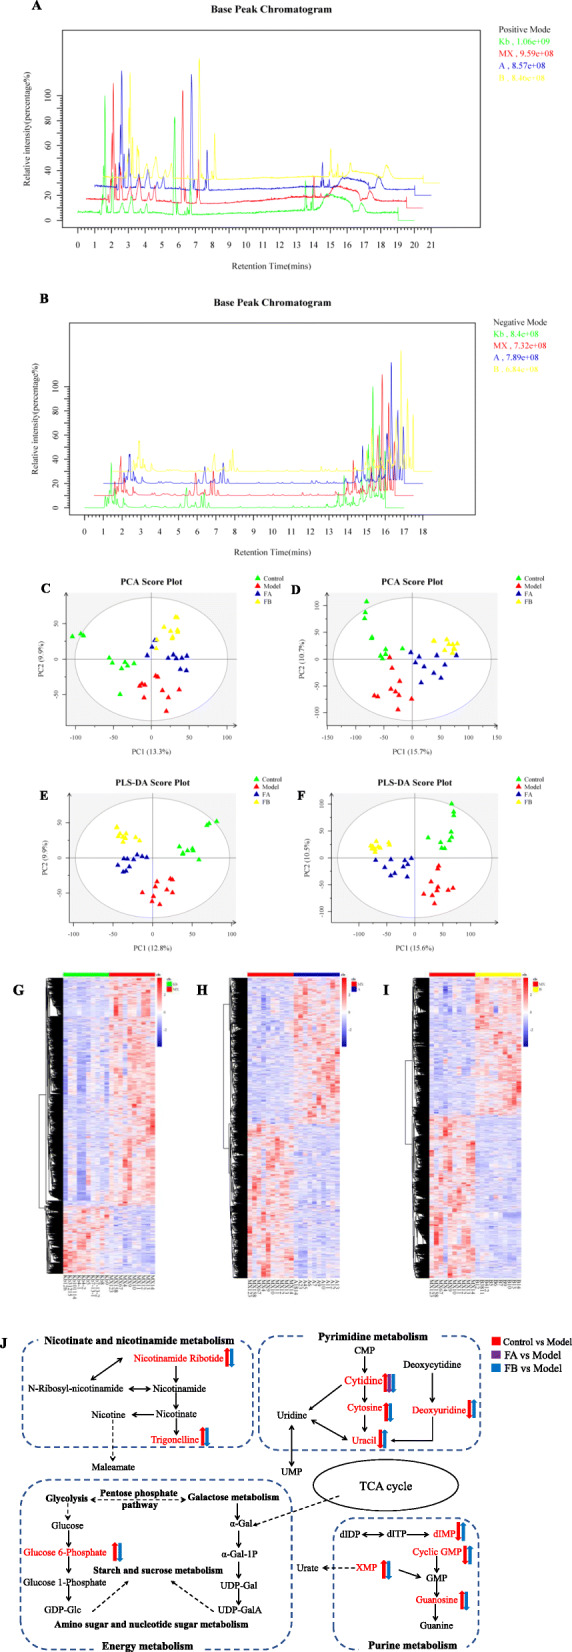
IMAGE

Fig. 4

ID
ZDB-IMAGE-200610-34
Source
Figures for Gong et al., 2020
Image
Figure Caption

Fig. 4

Metabolomic analyses of zebrafish larvae samples from the control, model, FA, and FB groups. Representative base peak chromatogram (BPC) of the control, model, FA, and FB groups in the positive ion mode (a) and negative ion mode (b). PCA score plot of metabolites in the positive ion mode (c) and negative ion mode (d). PLS-DA score plot of metabolites in the positive ion mode (e) and negative ion mode (f). Heat-map of differential metabolites of control vs. model (g), model vs. FA (h), and model vs. FB (i). Rows: differential metabolites; Columns: zebrafish larvae samples. The rectangle in different colors represented the expression level of metabolites: the highest (red), the lowest (blue), and the mean (white). j Metabolic pathways (bold) participating in the anti-inflammatory process of FA and FB against CuSO4-induced inflammation in zebrafish. The metabolites (red) were the identified biomarkers in the present study. Arrows near metabolites indicated the biomarkers’ relative expressions of control vs. model, model vs. FA, and model vs. FB

Acknowledgments
This image is the copyrighted work of the attributed author or publisher, and ZFIN has permission only to display this image to its users. Additional permissions should be obtained from the applicable author or publisher of the image. Full text @ J Neuroinflammation