
IMAGE
Fig. 7
- ID
- ZDB-IMAGE-200605-27
- Genes
- Publication
- Xia et al., 2020 - ube3d, a New Gene Associated with Age-Related Macular Degeneration, Induces Functional Changes in Both In Vivo and In Vitro Studies
- All Figures
- Figures for Xia et al., 2020
Image
|
Figure Caption
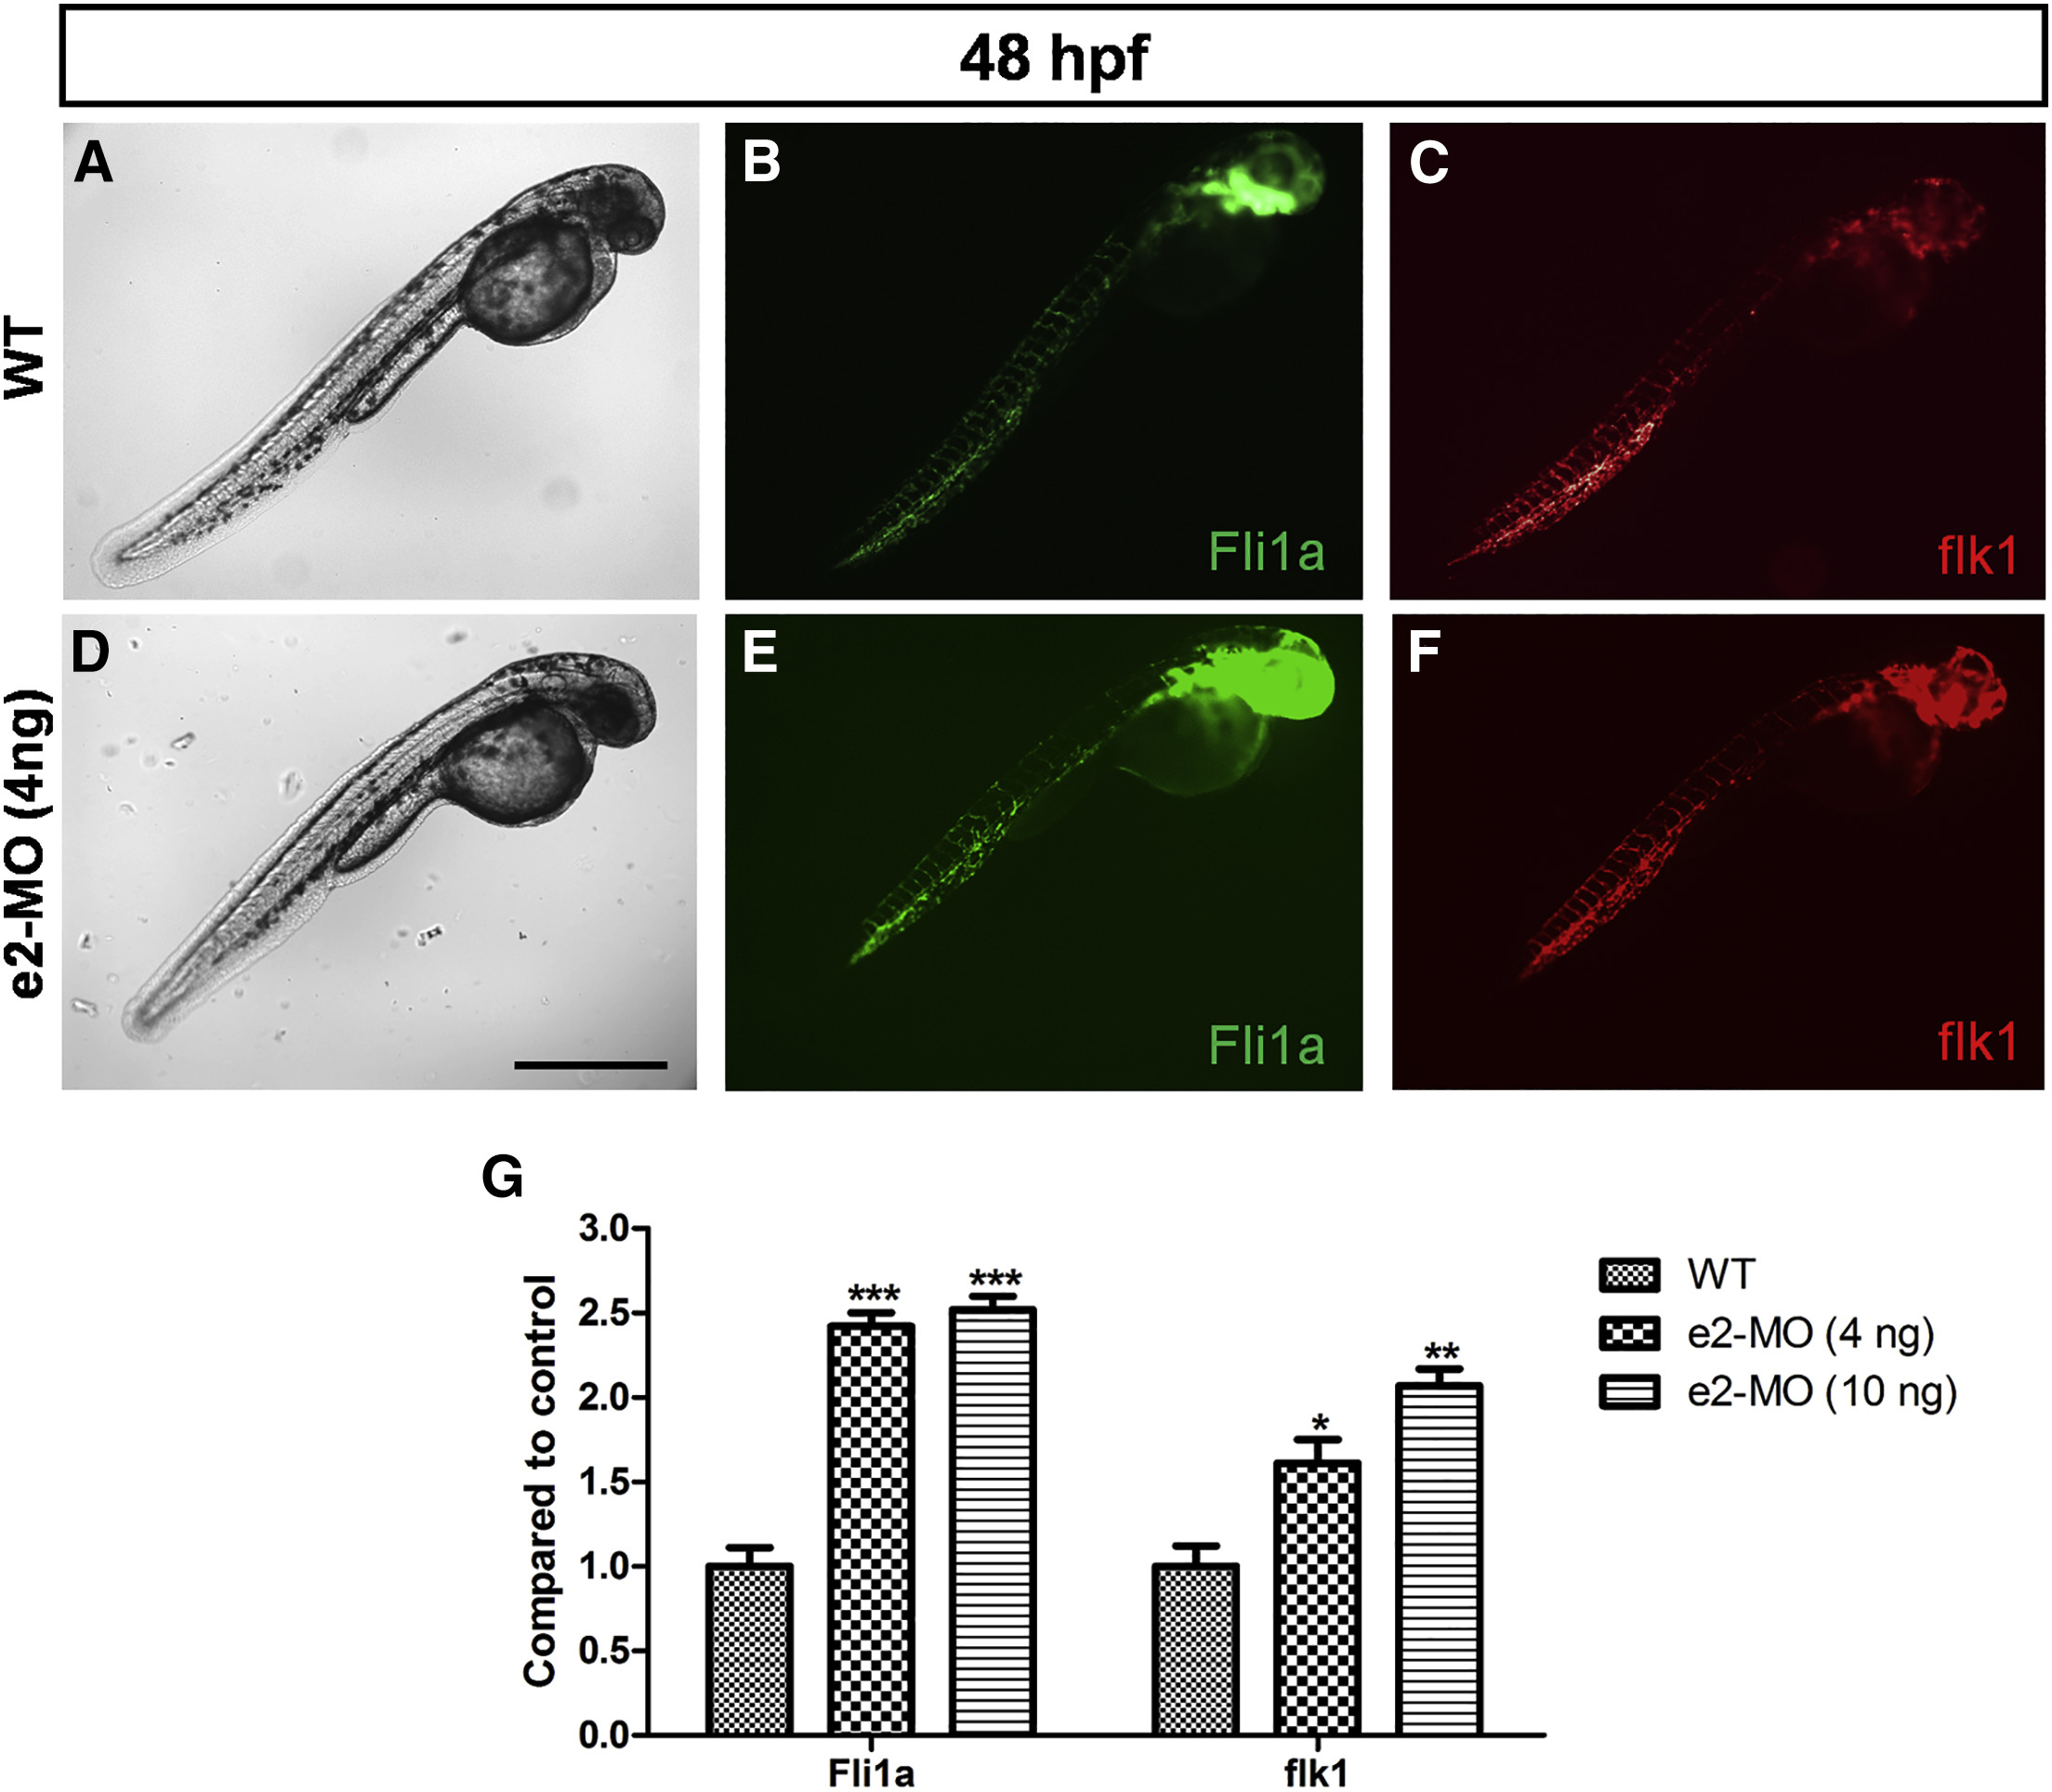
Fig. 7
Knockdown of ube3d Promotes Angiogenesis
(A–C) Live images (A), Fli1a expression (B), and flk1 expression (C) in WT 48-hpf larvae. (D–F) Live images (D), Fli1a expression (E), and flk1 expression (F) in e2-MO (4 ng) 48-hpf larvae. (G) The expression levels of Fli1a and flk1 were significantly increased in e2-MO 48-hpf larvae. The data are presented as the mean ± SD. ∗p < 0.05, ∗∗p < 0.01, ∗∗∗p < 0.001. Scale bar represents 500 μm.
Figure Data
Acknowledgments
This image is the copyrighted work of the attributed author or publisher, and
ZFIN has permission only to display this image to its users.
Additional permissions should be obtained from the applicable author or publisher of the image.
Full text @ Mol Ther Nucleic Acids