
|
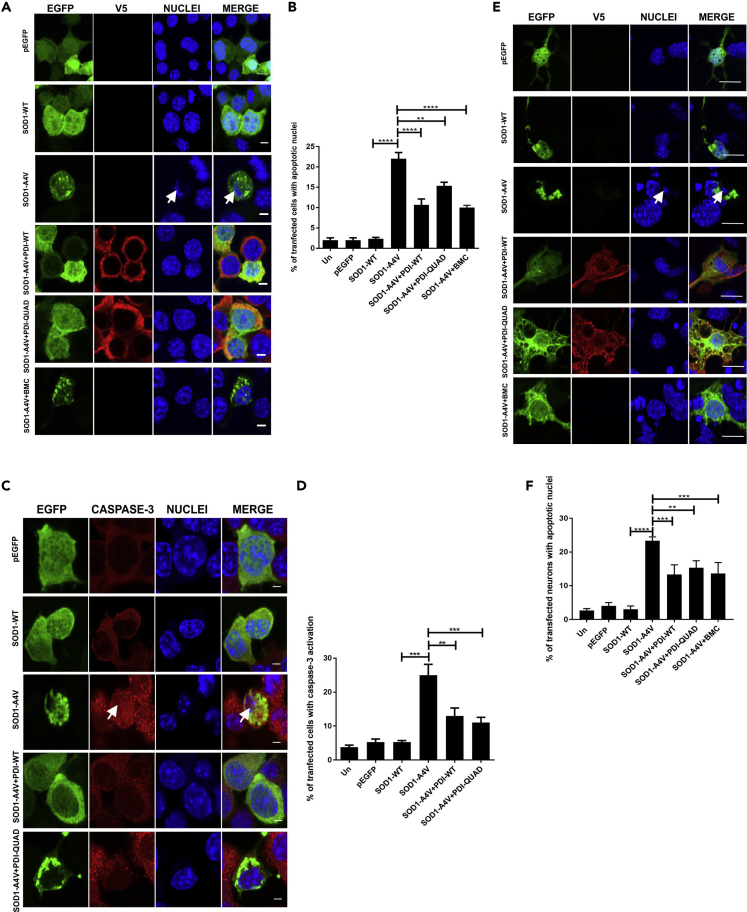
Figure 8
The Oxidoreductase and Chaperone Activities of PDI Are Protective against Mutant SOD1 Induced Cell Death
(A) Neuro-2a cells expressing EGFP (row 1), SOD1-WT (row 2) or SOD1-A4V (row 3, condensed nuclei represented by white arrows), SOD1-A4V co-expressing PDI-WT or PDI-QUAD, or BMC treatment (rows 4, 5, 6).
(B) Over-expression of PDI-WT (∗∗∗∗p < 0.0001), PDI-QUAD (∗∗p < 0.01) or BMC (∗∗∗∗p < 0.0001) with SOD1-A4V resulted in significantly fewer condensed apoptotic cells. A significant difference was observed between SOD1-WT and SOD1-A4V expressing cells (∗∗∗∗p<0.0001).
(C) Immunocytochemistry using activated caspase-3 antibodies (red), white arrow represents caspase-3 activation. Cells expressing EGFP (row 1), SOD1-WT (row 2), SOD1-A4V (row 3), or co-expressing SOD1-A4V and PDI-WT or PDI-QUAD (rows 4, 5).
(D) Over-expression of both PDI-WT (∗∗p < 0.01) and PDI-QUAD (∗∗∗p < 0.001) with SOD1-A4V significantly decreased the proportion of cells with activated caspase-3.
(E) Primary neurons expressing pEGFP (row 1), SOD1-WT (row 2), or SOD1-A4V (row 3), co-expressing PDI-WT or PDI-QUAD, or treatment with BMC (rows 4, 5, 6).
(F) Co-expression of PDI-WT (∗∗∗p < 0.001) or PDI-QUAD (∗∗p < 0.01) or treatment with BMC (∗∗∗p < 0.001) in SOD1-A4V expressing cells resulted in significantly fewer cells with apoptotic nuclei, identified by the presence of activated caspase-3. A significant difference was observed between SOD1-WT and SOD1-A4V (∗∗∗∗p<0.0001).
Scale bars: 4 μm in (A) and (C), 10 μm in (E).