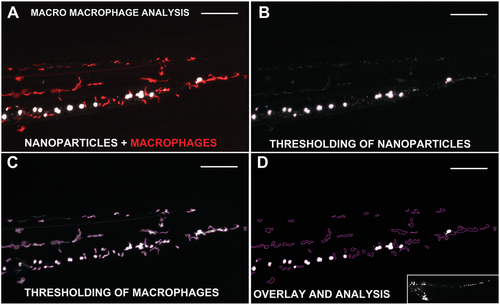
Image


                        Figure Caption


Fig. 5
Macrophage uptake of NPs. Illustration of the steps undertaken by the MACRO for macrophage analysis to calculate the uptake of NPs. A) Zebrafish embryos injected with 623 nm liposomes without PEG (white) and fluorescent macrophages (red) are used for the analysis. B,C) NPs and macrophages are first thresholded, and D) their signals subsequently overlapped for analysis. The obtained values are normalized by the fluorescence of the whole zebrafish (panel (D), lower image).
                
                    
                        Acknowledgments


This image is the copyrighted work of the attributed author or publisher, and
ZFIN has permission only to display this image to its users.
Additional permissions should be obtained from the applicable author or publisher of the image.
      Full text @ Small


        