
|
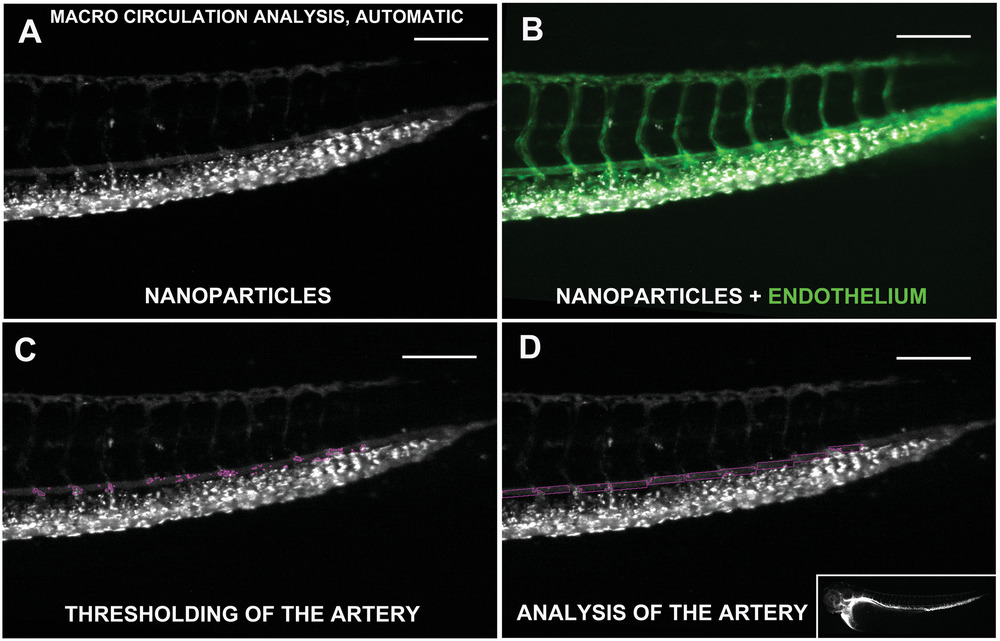
Fig. 2
Circulation of NPs in the zebrafish embryo, automatic analysis. This image shows the steps performed by the MACRO for the analysis of the fluorescence in the caudal artery. A) The image processing of zebrafish injected with fluorescent NPs (99 nm PEGylated liposomes with biotin) utilizes B) the fluorescent signal of the vasculature to identify the caudal artery. C) Fluorescence due to NP uptake in the artery is removed, and D) regions in between intersegmental vessels are automatically detected to calculate the relative fluorescence. The results are then normalized relative to the fluorescence of the whole fish (panel (D), lower right image).