
Fig. 5
- ID
- ZDB-IMAGE-200514-13
- Publication
- Koth et al., 2020 - Runx1 promotes scar deposition and inhibits myocardial proliferation and survival during zebrafish heart regeneration
- All Figures
- Figures for Koth et al., 2020
|
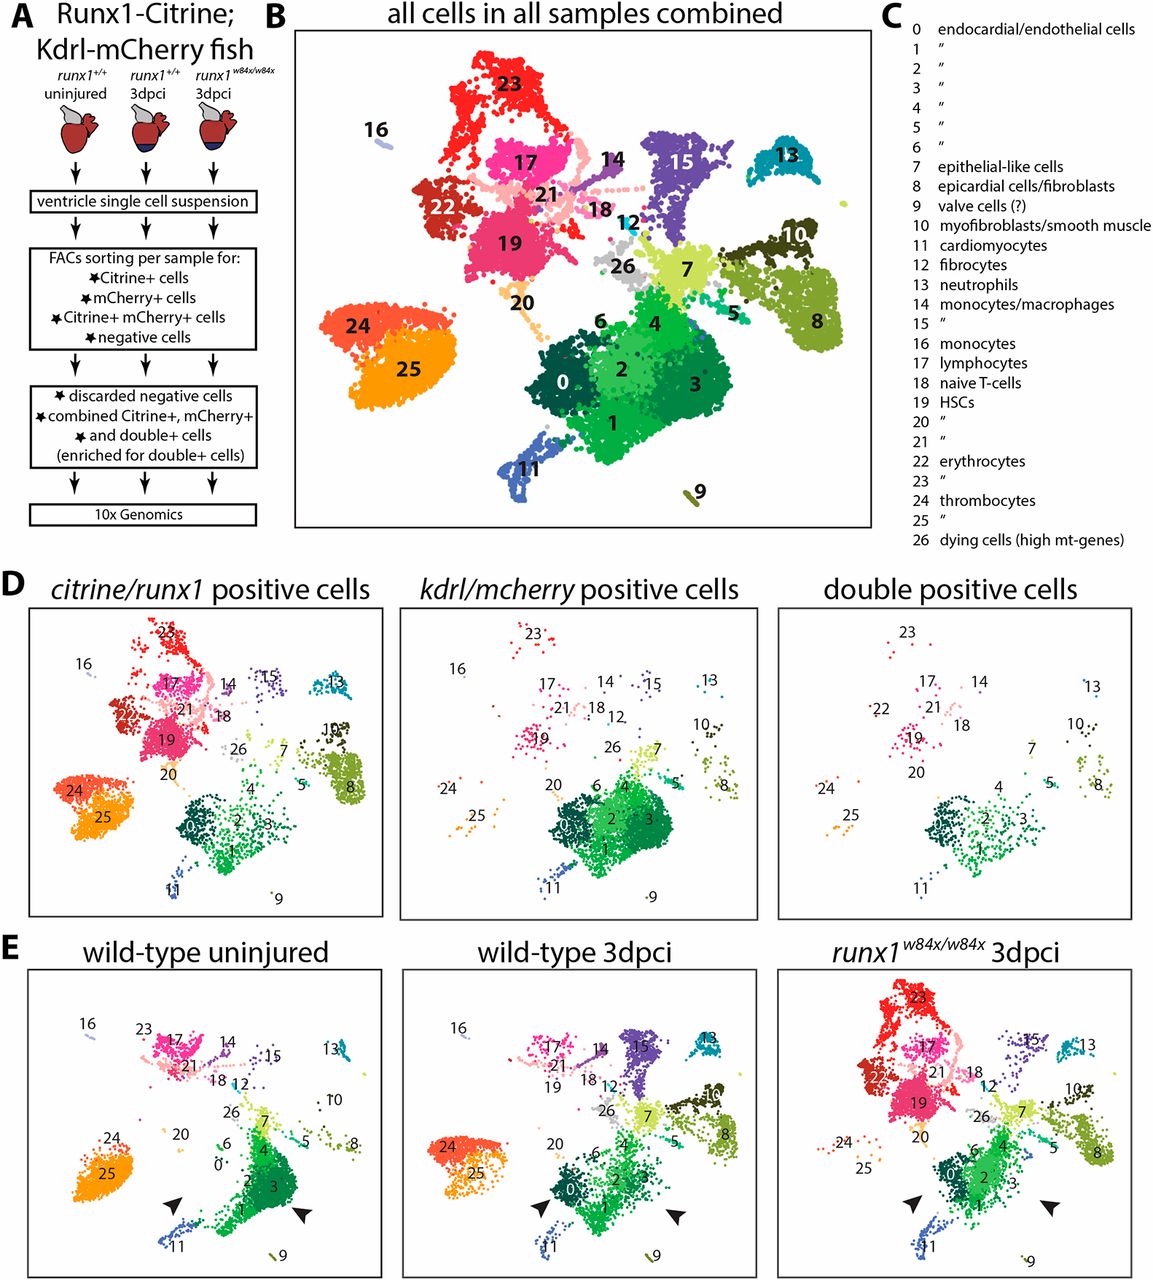
Fig. 5 Single cell sequencing of Citrine- and mCherry-positive cells. (A) Experimental design of selection of cells for single cell sequencing using the 10x Genomics platform. (B) UMAP plot of all cells combined, clustering into 27 different clusters. (C) Annotation of the different cell clusters. (D) UMAP plot separated into citrine/runx1-positive cells, mcherry/kdrl-positive cells and double-positive cells. (E) UMAP plot separated into wild-type uninjured cells, wild-type 3 dpci cells and runx1 mutant 3 dpci cells. Arrowheads indicate the shift in endocardial/endothelial cells, with C0 and C2 appearing, and C3 reducing in size after injury. HSC, haematopoietic stem cells; mt, mitochondrial.