
Fig. 2
- ID
- ZDB-IMAGE-200514-10
- Publication
- Koth et al., 2020 - Runx1 promotes scar deposition and inhibits myocardial proliferation and survival during zebrafish heart regeneration
- All Figures
- Figures for Koth et al., 2020
|
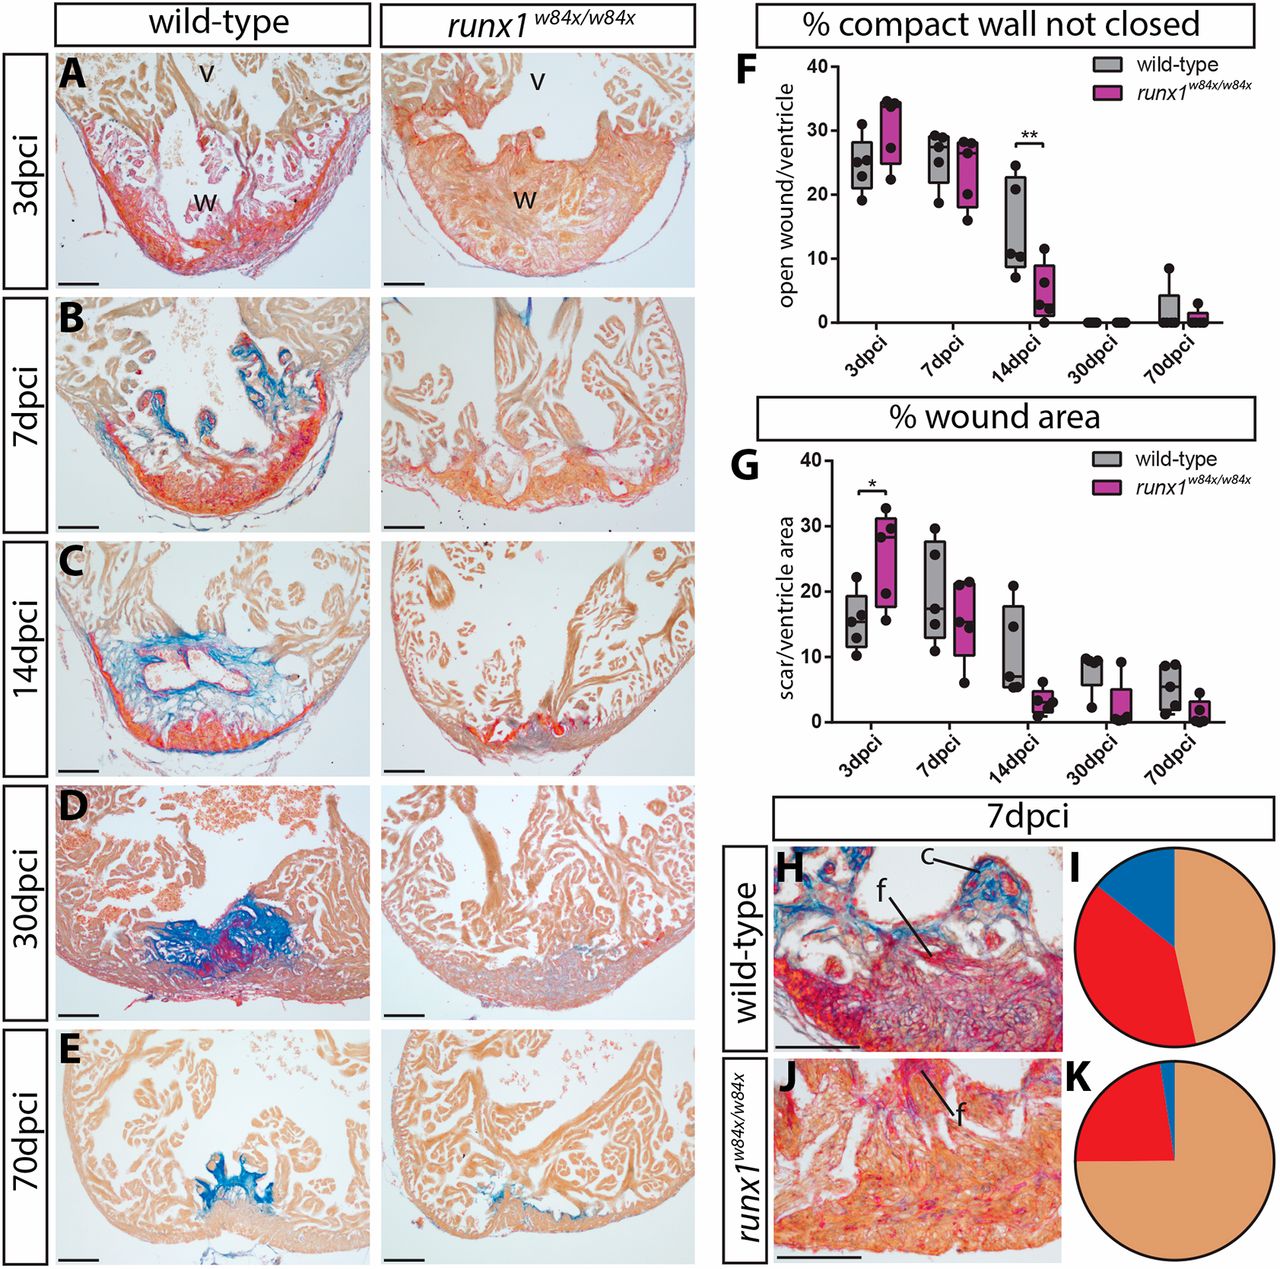
Fig. 2 Different wound composition and faster regeneration in runx1 mutant compared with wild-type hearts. (A-E) AFOG staining of wild-type and runx1 mutant ventricles at five different time points after injury. (F,G) Quantification of the difference in wound size between the wild type and mutant at the different time points, measured by the percentage of the compact wall not yet closed (F) and the percentage of wound area compared with total ventricle area (G). n=5 per time point, two-way ANOVA with Sidak test. *P<0.05 and **P<0.01. Box extends from the 25th to 75th percentiles and whiskers indicate minimum to maximum with all data points shown. (H-K) Quantification of differences in wound composition between the fish at 7 dpci (collagen, blue; fibrin, bright red; all other cells, including myocardium/blood cells are orange), n=5. c, collagen; f, fibrin; v, ventricle; w, wound. Scale bars: 100 μm.