
Fig. 3
- ID
- ZDB-IMAGE-200513-13
- Antibodies
- Publication
- Liu et al., 2020 - Eyes shut homolog (EYS) interacts with matriglycan of O-mannosyl glycans whose deficiency results in EYS mislocalization and degeneration of photoreceptors
- All Figures
- Figures for Liu et al., 2020
|
Fig. 3
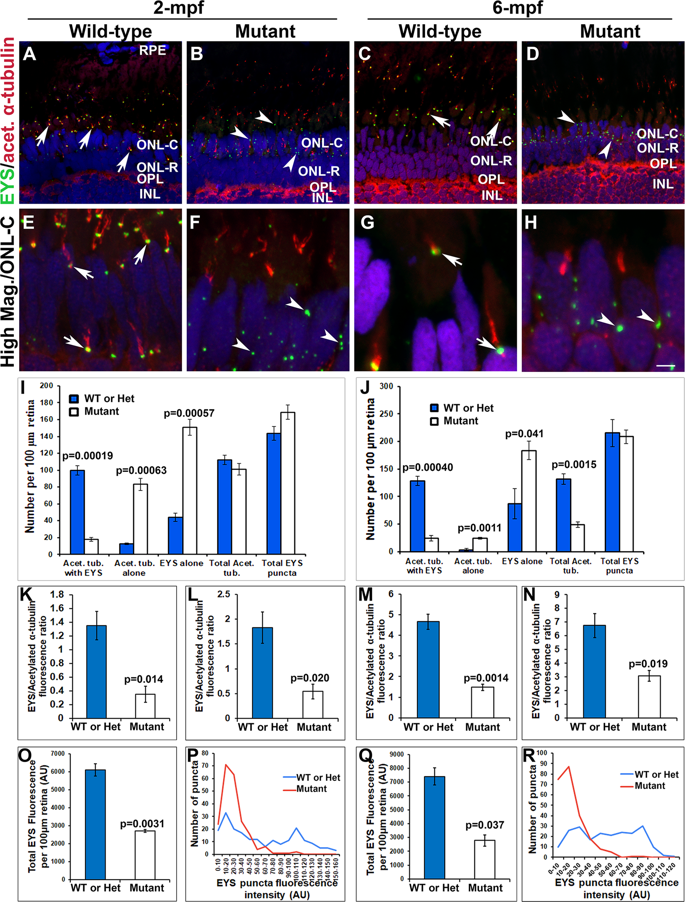
Mislocalization of EYS protein in pomgnt1 mutant zebrafish retina. Retinal sections from wild-type and pomgnt1sny7 mutant zebrafish were double immunostained with EYS (green fluorescence) and acetylated α-tubulin (red fluorescence). (A and E) Wild-type retina at 2-mpf. (C and G) Wild-type retina at 6-mpf. Most EYS-positive puncta in the wild-type retina were associated with basal end of the acetylated α-tubulin reactivity at both 2- and 6-mpf (arrows). (B and F) Homozygous pomgnt1sny7 mutant retina at 2-mpf. (D and H) Homozygous pomgnt1sny7 mutant retina at 6-mpf. Most EYS-positive puncta were not associated with acetylated α-tubulin but were localized in the outer nuclear layer at both 2- and 6-mpf (arrowheads). (I and J) Counting of EYS-acetylated α-tubulin double staining from the outer nuclear layer to the retinal pigment epithelium (RPE) for 2-mpf and 6-mpf retina, respectively. Note that acetylated α-tubulin reactivity associated with EYS puncta was decreased in the mutant, and acetylated α-tubulin not associated with EYS puncta was increased in the mutant. EYS puncta not associated with acetylated α-tubulin was increased in the mutant. ANOVA; post-hoc Student’s t-test with Bonferroni correction.(K and L) Ratio of EYS and acetylated α-tubulin immunoreactivity for each acetylated α-tubulin-labeled axoneme in rods and cones at 2-mpf, respectively. Note that EYS immunoreactivity at the connecting cilium was reduced by about 5-fold in pomgnt1 mutant retina. Student’s t-test. (M and N) Ratio of EYS and acetylated α-tubulin immunoreactivity per acetylated α-tubulin-labeled axoneme in rods and cones at 6-mpf, respectively. Note that EYS immunoreactivity at the connecting cilium was also reduced in the pomgnt1mutant retina at 6-mpf. Student’s t-test. (O and Q) Total EYS immunoreactivity at 2-mpf and 6-mpf, respectively. Total EYS immunoreactivity was reduced in pomgnt1 mutant retina at both ages. Student’s t-test. (P and R) Histogram representation of total EYS immunoreactivity between wild-type/heterozygous and mutant fish at 2-mpf and 6-mpf, respectively. Note the shift in the number of EYS puncta to lower fluorescence intensities in the pomgnt1 mutant fish at both ages. Scale bar in H: 5 µm for A-D; 2.5 µm for E-H.