IMAGE

Figure 5

ID
ZDB-IMAGE-200509-18
Antibodies
Source
Figures for Furlan et al., 2020
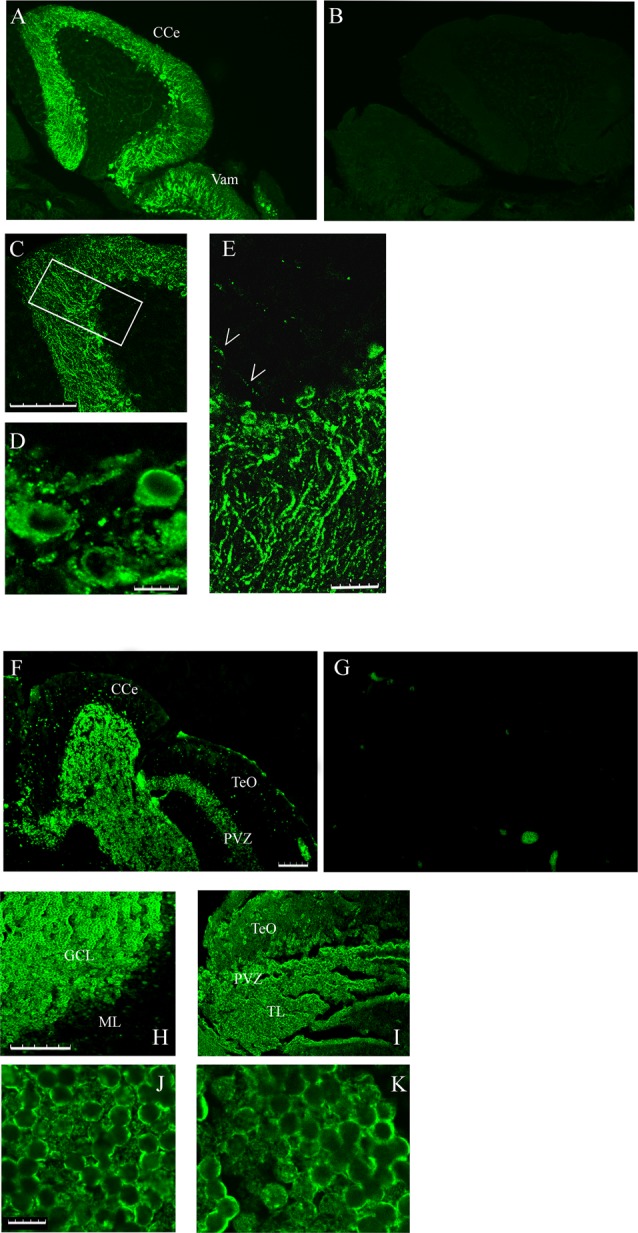
Image
Figure Caption

Figure 5

Immunofluorescence staining of sagittal brain sections area restricted to the cerebellum and the optic tectum (rostral to the right) decorated with CC (A,C–E) and MC (F,H–K) antibodies. (B,G) Images collected from control sections (see “Results” section) and acquired with the same conditions as in (A) and (F), respectively. (A,B,F,G) Epi-fluorescence signals. (C–E,H–K) Images obtained by single optic section of confocal analysis. The box in (C) indicates the area shown at higher magnification in (E). (D) PCL in a different region and focal plane. Arrows: axons of Purkinje cells. The abbreviations are the same as in Figure 4. (A,C,F,H,I) Bar: 100 μm. (E) Bar: 25 μm. (D,J,K) Bar: 7.5 μm.

Figure Data
Acknowledgments
This image is the copyrighted work of the attributed author or publisher, and ZFIN has permission only to display this image to its users. Additional permissions should be obtained from the applicable author or publisher of the image. Full text @ Front. Neuroanat.