
Image
|
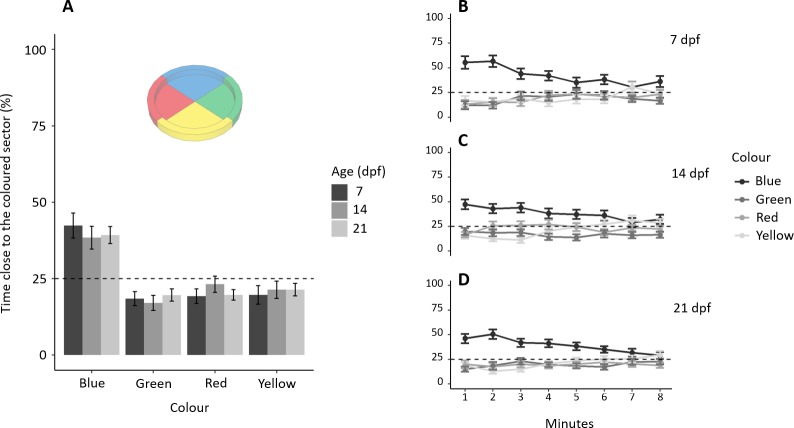
Figure Caption
Figure 2
(A) Percentage of time (mean ± standard error) spent in each coloured sector in 7, 14 and 21-dpf larvae. Larvae showed a preference for the blue sectors compared to the other colours (all
Acknowledgments
This image is the copyrighted work of the attributed author or publisher, and
ZFIN has permission only to display this image to its users.
Additional permissions should be obtained from the applicable author or publisher of the image.
Full text @ Peer J.