
|
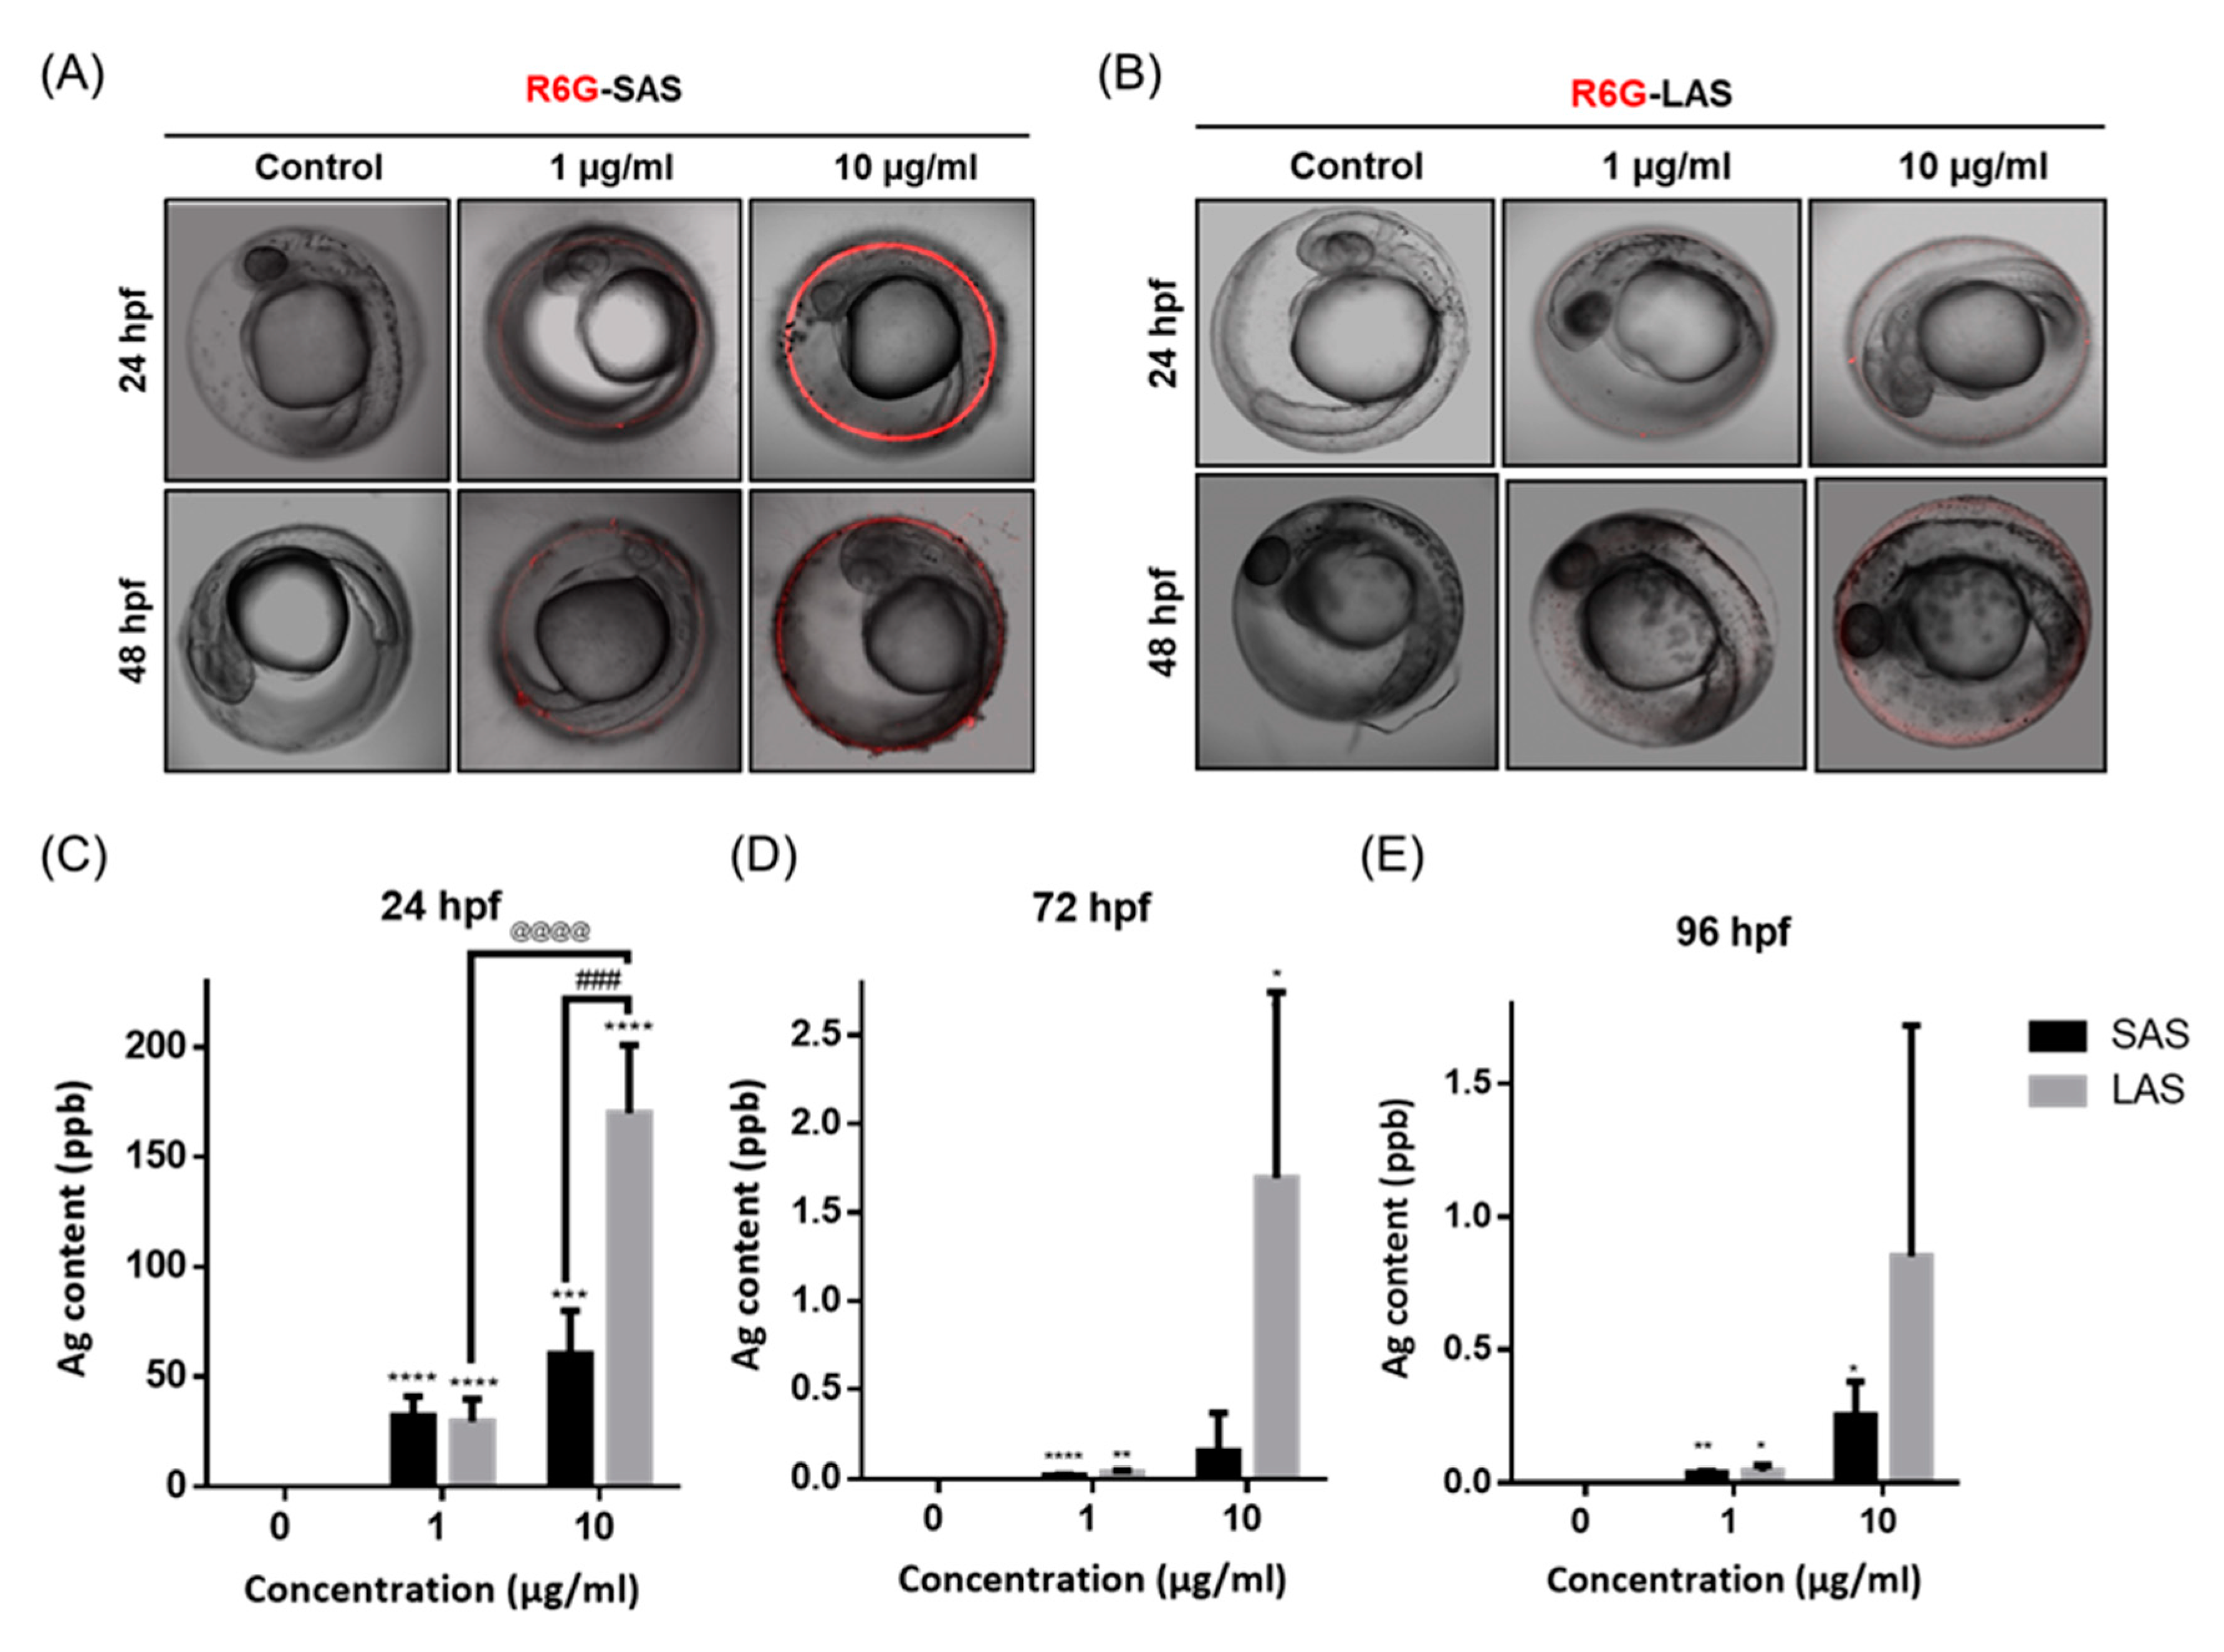
Fig. 2
The metal accumulation of SAS and LAS. Zebrafish embryo were exposed to 1, 10 µg/mL R6G conjugated (A) SAS (B) LAS at 24–48 hpf. Red fluorescence signals represent deposition of AgNPs. The retention of silver in embryos at (C) 24, (D) 72, (E) 96 hpf. The level of silver ion was detected by atomic absorption spectrophotometer analyses. The experiment was performed thrice using 30 embryos each. The values are presented as the mean ± SEM. Values significantly different from the control are indicated by asterisks (one-way ANOVA, followed by a t-test: * p< 0.05, ** p < 0.01, *** p < 0.001 and **** p < 0.0001). The significantly difference between SAS and LAS are indicated by pound sign (one-way ANOVA, followed by a t-test ### p < 0.001). The significantly difference between LAS 1 µg/mL and LAS 10 µg/mL groups are indicated by the at sign (one-way ANOVA, followed by a t-test @@@@ p < 0.0001).