
|
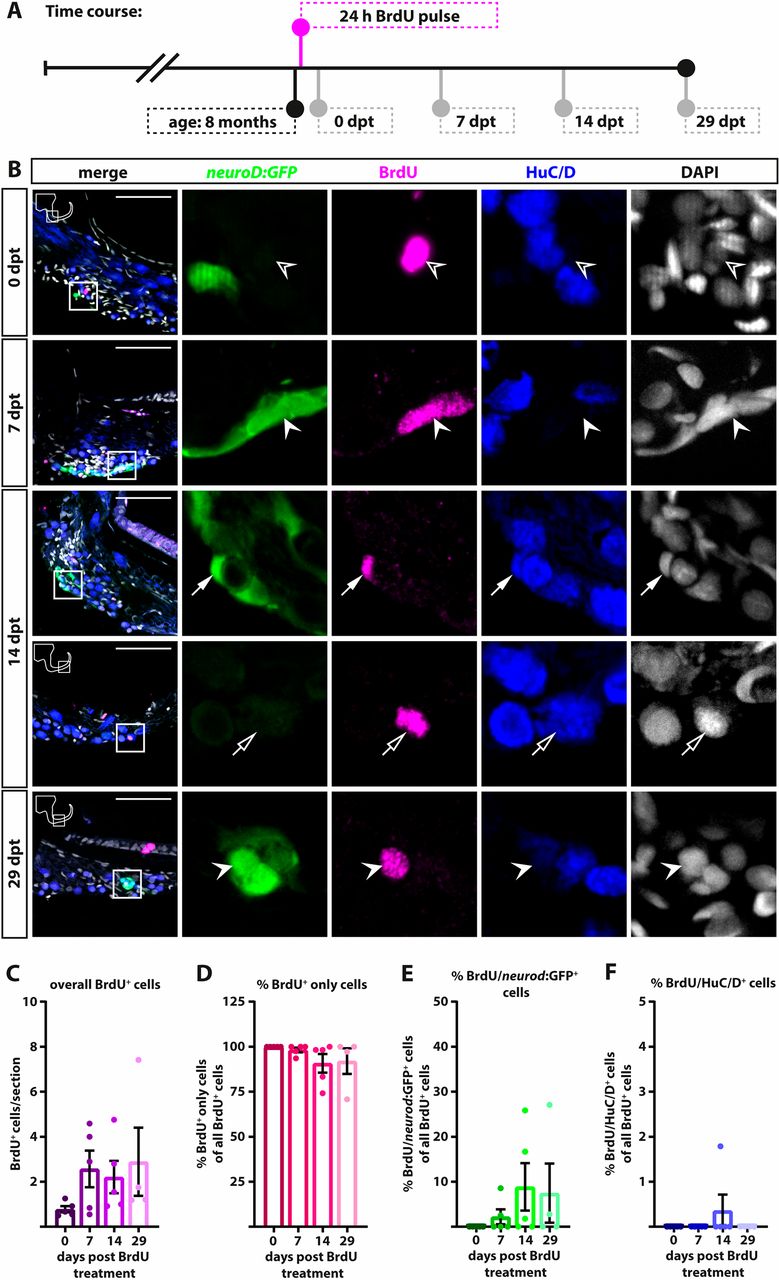
Fig. 5 A proliferating but marker-negative cell population replenishes the neurod:GFP-positive cell pool at adult stages. (A) Time course for BrdU pulse chase experiment: 8-month-old Tg(neurod:GFP) zebrafish were sacrificed at 0, 7, 14 and 29 dpt. (B) Antibody staining reveals that BrdU-positive cells never co-localize with neurod:GFP at 0 dpt (open arrowheads). However, BrdU/neurod:GFP-positive cells are present at 7 dpt (solid arrowheads). Newly generated neurod:GFP-positive cells can either differentiate into new neurons [BrdU/neurod:GFP/HuC/D-positive cells (solid arrows) and BrdU/HuC/D-positive cells (open arrows)], as can be seen as early as 14 dpt, or remain in the pool of neurod:GFP-positive cells (solid arrowheads) as can be seen at 29 dpt. Panels on right show magnification of boxed areas in left panels. (C-F) Quantification of overall BrdU-positive cells (C) as well as percentage of BrdU-positive-only cells (D), BrdU/neurod:GFP-positive cells (E) and BrdU/HuC/D-positive cells as a fraction of all BrdU-positive cells (F). Scale bars: 50 µm. Cross-sections show dorsal to the top and lateral to the right. For quantifications: 0, 7, 14 days, n=5; 29 days, n=4 (n=fish; 1 SAG/fish; 12 sections/SAG); data are presented as mean±s.e.m. Ordinary one-way ANOVA with Tukey's multiple comparison test.