
|
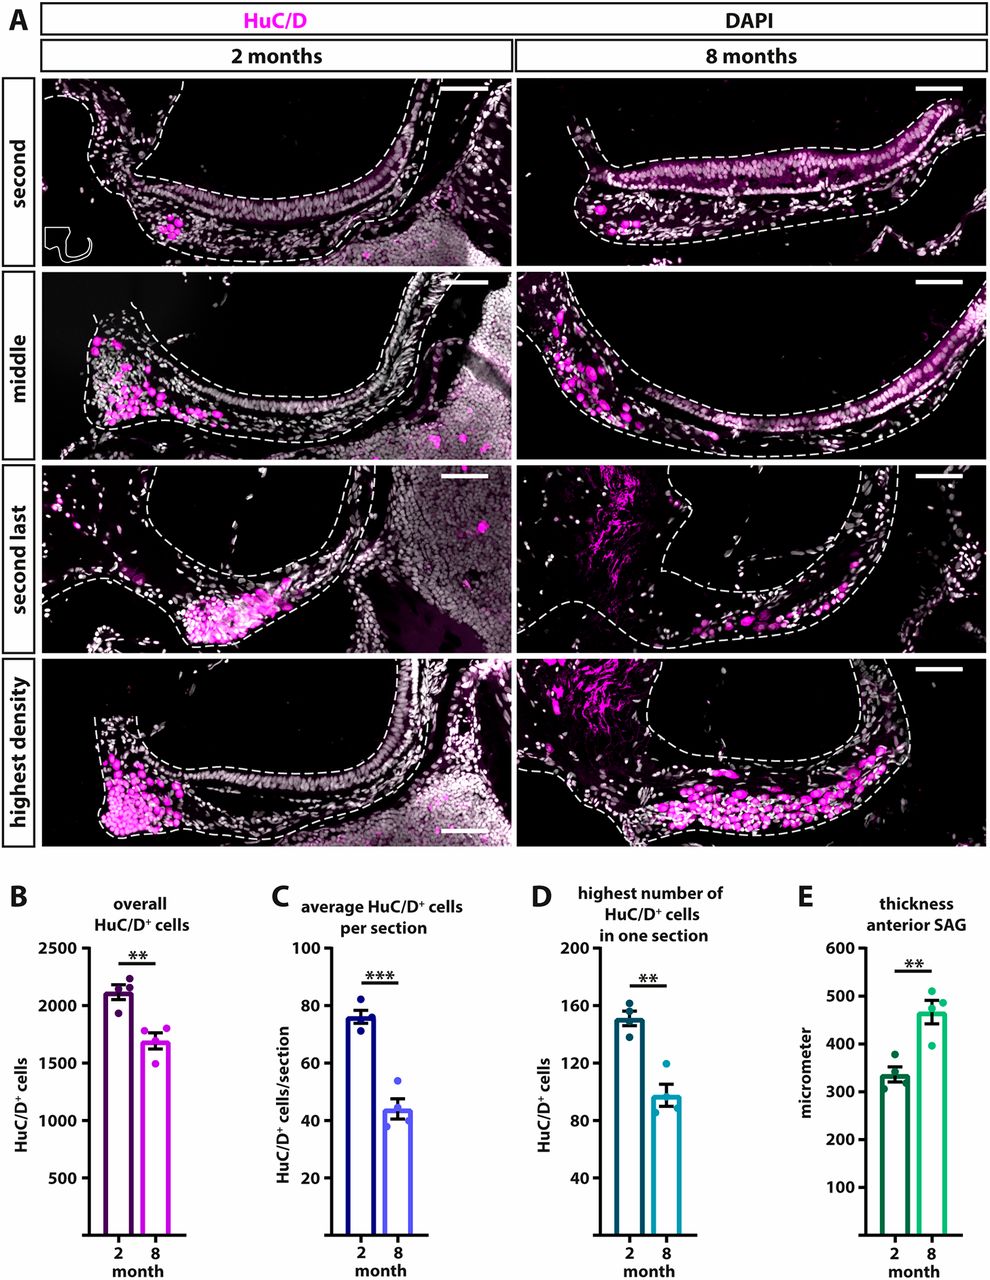
Fig. 2 Number and density of HuC/D-positive neurons decreases during growth of the SAG. (A) Antibody staining against neuronal marker HuC/D in the SAG of 2- and 8-month-old fish. The entire anterior part of the SAG was analyzed, starting with the first section with HuC/D-positive neurons and ending with the last section of the anterior part of the SAG. Shown are the second, middle and second-last section as well as the section with the highest density of HuC/D-positive cells. Note that in 2-month-old fish, the section with the highest density of HuC/D-positive cells is found in the first half of the anterior SAG, whereas at 8 months it is usually found in the last quarter of the anterior SAG. (B-E) Quantification of HuC/D-positive neurons in the entire anterior part of the SAG, showing that the overall number of HuC/D-positive cells (B), the average number of HuC/D-positive cells per section (C) and highest number of HuC/D-positive cells on one section (D) decreases, whereas the overall thickness of the anterior SAG along the anteroposterior axis (E) increases during growth. Scale bars: 50 µm. Cross-sections show dorsal to the top and lateral to the right. For all quantifications: n=4 fish with mean values calculated of all sections of both anterior SAGs; data are presented as mean±s.e.m. Unpaired two-tailed Student's t-test. **P≤0.01; ***P≤0.001.