
IMAGE
Figure 9
- ID
- ZDB-IMAGE-200430-20
- Publication
- Paudel et al., 2020 - Pilocarpine Induced Behavioral and Biochemical Alterations in Chronic Seizure-Like Condition in Adult Zebrafish
- All Figures
- Figures for Paudel et al., 2020
Image
|
Figure Caption
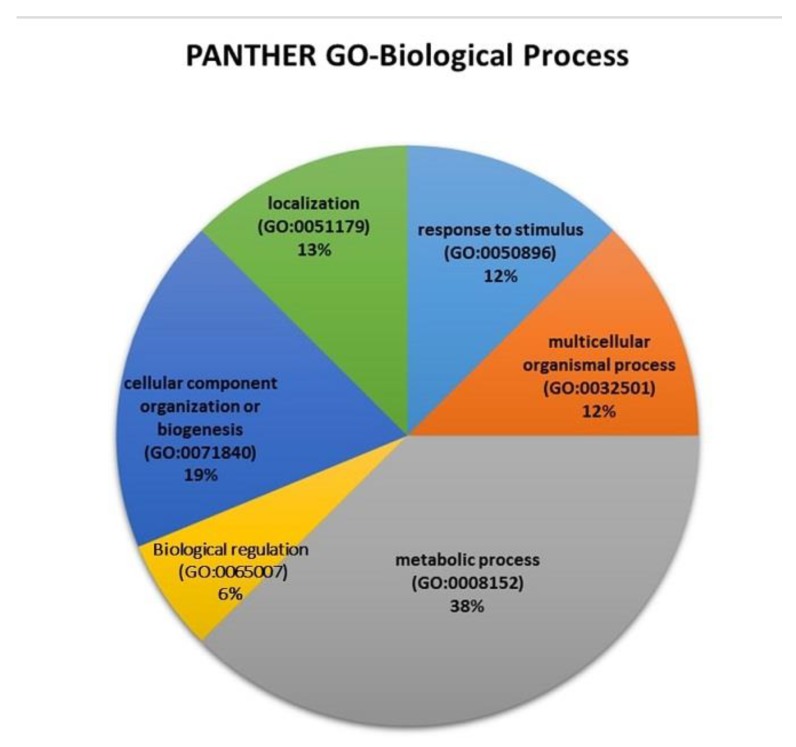
Figure 9
Biological process for the differentially expressed proteins. Biological processes for the differentially expressed proteins identified from the label free quantification approach. The pie chart was generated using PANTHER GO-classification system software.
Figure Data
Acknowledgments
This image is the copyrighted work of the attributed author or publisher, and
ZFIN has permission only to display this image to its users.
Additional permissions should be obtained from the applicable author or publisher of the image.
Full text @ Int. J. Mol. Sci.