
IMAGE
Figure 8
- ID
- ZDB-IMAGE-200430-19
- Publication
- Paudel et al., 2020 - Pilocarpine Induced Behavioral and Biochemical Alterations in Chronic Seizure-Like Condition in Adult Zebrafish
- All Figures
- Figures for Paudel et al., 2020
Image
|
Figure Caption
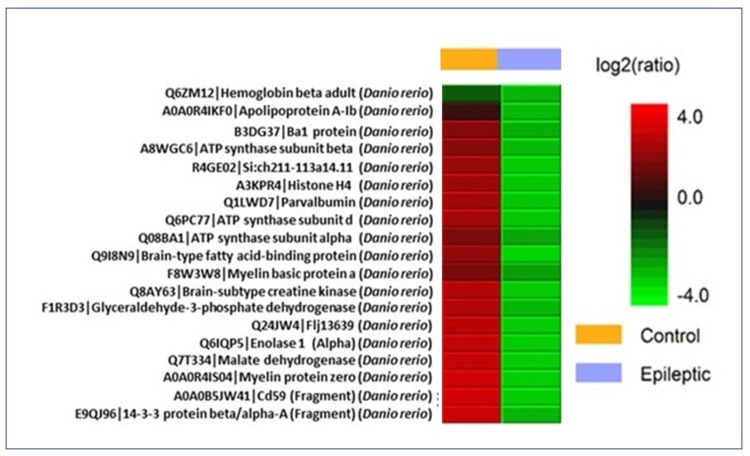
Figure 8
Differential expression (LFQ) of normal vs. epileptic zebrafish brain protein extract denoted by heat map. Label free quantification heat map for proteins identified from zebrafish brain (control vs. epileptic). Proteins with high ratio and low ratio are labelled red and green respectively. Samples are taken in triplicate where yellow line denotes epileptic group and light blue line denotes normal control group.
Acknowledgments
This image is the copyrighted work of the attributed author or publisher, and
ZFIN has permission only to display this image to its users.
Additional permissions should be obtained from the applicable author or publisher of the image.
Full text @ Int. J. Mol. Sci.