IMAGE

Figure 5

ID
ZDB-IMAGE-200430-16
Source
Figures for Paudel et al., 2020
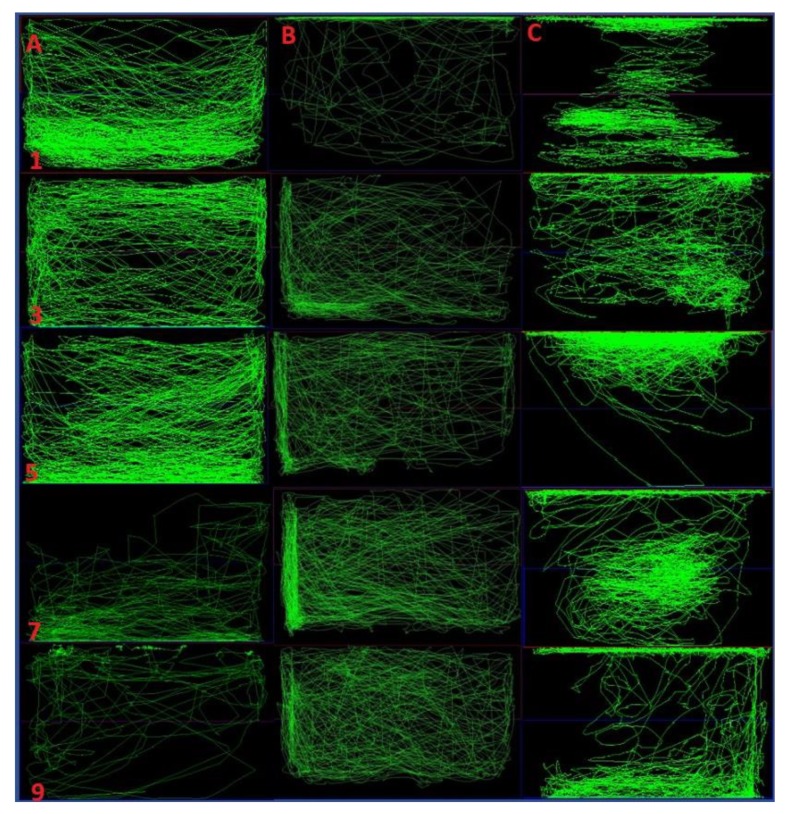
Image
Figure Caption

Figure 5

Comparison of locomotor pattern and behavior of fish. Single dose and repeated dose of pilocarpine treatment versus normal control. Representative swimming patterns (behavior recording) for the corresponding three experimental groups (AC). The swimming pattern for the group (A) represents the 10% DMSO only vehicle control. The swimming pattern for the group (B) represents the single dose of Pilocarpine (400 mg/kg) whereas the swimming pattern for the group (C) represents the repeated dose of Pilocarpine (400 mg/kg) for 10 days. The number in the rows represents the swimming pattern of the specific day (1, 3, 5, 7, 9).

Acknowledgments
This image is the copyrighted work of the attributed author or publisher, and ZFIN has permission only to display this image to its users. Additional permissions should be obtained from the applicable author or publisher of the image. Full text @ Int. J. Mol. Sci.