
Fig 5
- ID
- ZDB-IMAGE-200429-5
- Publication
- Arribat et al., 2020 - Spastin mutations impair coordination between lipid droplet dispersion and reticulum
- All Figures
- Figures for Arribat et al., 2020
|
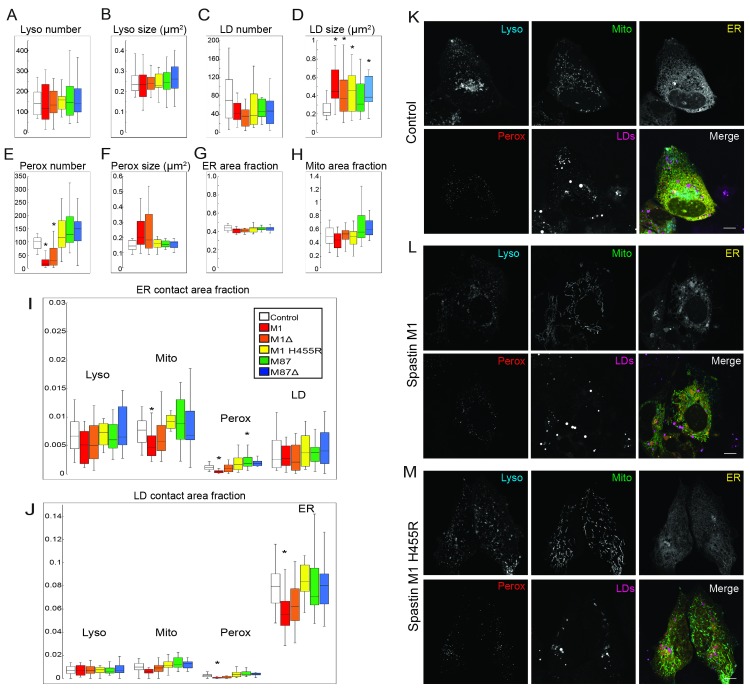
Fig 5
Multispectral analysis of organelle size and number in U2OS cells expressing humans Spastin isoforms M1, M1Δex4, M87, M87Δex4 and the mutant M1H455R. (A-B) Quantification of lysosome (Lyso) number per cell and median size. (C-D) Quantification of LD number per cell and median size. (E-F) Quantification of peroxisome (Perox) number per cell and median size. (G) Quantification of ER area per cell. (H) Quantification of mitochondria (Mito) area per cell. (I) Quantification of organelle contact area fraction centered on ER. (J) Quantification of organelle contact area fraction centered on LDs. (K-M) Representative images of U2OS cells expressing mock (K), human Spastin M1 (L) and the mutant counterpart M1H455R (M). Scale bars, 10 μm. Box whisker plots, statistical tests are unpaired