
|
Figure 2
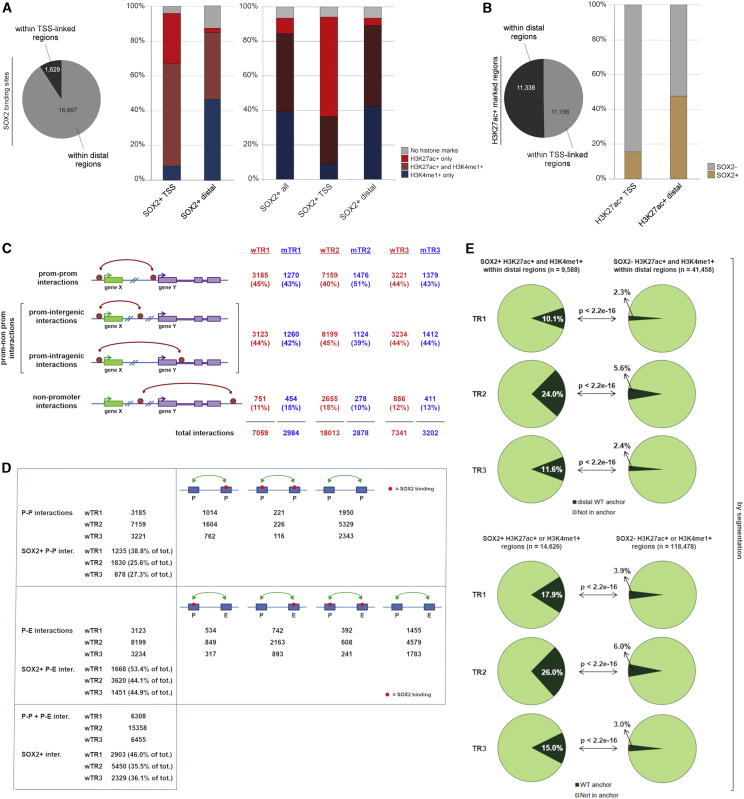
SOX2-Bound Regions Carrying Epigenetic Enhancer Marks (EM) Show Significantly Higher Overlap with Anchors Than SOX2-Negative EM-Positive Regions
(A) Left: number of SOX2-bound sites in regions linked to annotated TSS (±1,000 nt) and in distal, non-P regions. Right (histograms): percentage of different enhancer marks (EMs)-positive regions within SOX2-bound TSS-linked (SOX2+ TSS) or distal (SOX2+ distal) regions (left histograms, peak calling; right histograms, chromHMM).
(B) Fraction of SOX2-bound sites within EM-positive regions (H3K27Ac+) on TSS-linked or distal regions (peak calling).
(C) Interaction types according to the nature of the connected regions, for wTR1, wTR2, wTR3, mTR1, mTR2, and mTR3. “Prom,” annotated TSS-containing region (i.e., promoter).
(D) Numbers of P-P and P-nonP (P-E) SOX2-positive interactions in WT cells in wTR1, wTR2, and wTR3. See also
(E) Fraction of SOX2+ (left) versus SOX2− (right) EM-positive regions that overlap with anchors in wTR1, wTR2, and wTR3. Top: distal epigenetically marked regions (H3K27Ac+ and H3K4me1+) overlap with distal anchors. Bottom: all epigenetically marked regions (H3K27Ac+ or H3K4me1+) overlap with all anchor types, chromHMM.
See also