IMAGE

Figure 6

ID
ZDB-IMAGE-200426-12
Source
Figures for Bertolini et al., 2019
Image
Figure Caption

Figure 6

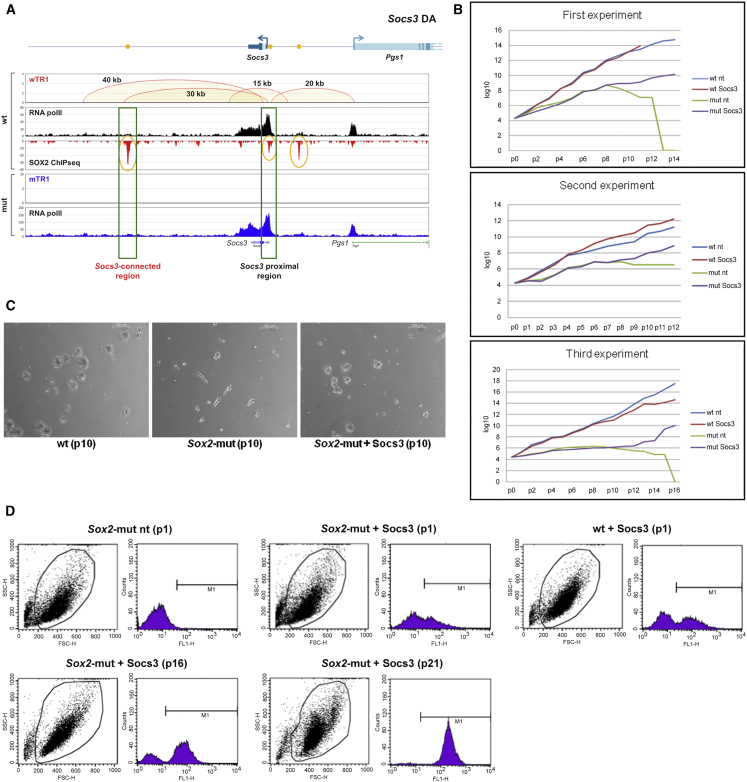
SOCS3 Re-expression in MUT NSCs Prevents NSC Exhaustion and Restores Self-Renewal

(A) Top: Socs3 gene. ChIA-PET interactions, SOX2 peaks, and ChIA-PET reads in WT NSCs. Bottom: loss of interactions in Sox2-MUT NSCs.

(B) Growth curves of MUT NSCs, not transduced (MUT) or transduced (MUT Socs3) with a Socs3-GFP-expressing lentivirus, and of WT controls (WT or WT Socs3).

(C) Images (phase-contrast) of MUT or Socs3-transduced MUT NSCs 3 days after passage 12; neurospheres develop only from Socs3-transduced NSCs. For comparison, WT NSCs.

(D) FACS analysis (GFP) of MUT, WT, and MUT Socs3 cells at the indicated passage number. With passaging, the fraction of GFP+ NSCs progressively increases in MUT Socs3 NSCs, eventually reaching 100%.

Acknowledgments
This image is the copyrighted work of the attributed author or publisher, and ZFIN has permission only to display this image to its users. Additional permissions should be obtained from the applicable author or publisher of the image. Full text @ Cell Stem Cell