
Image
|
Figure Caption
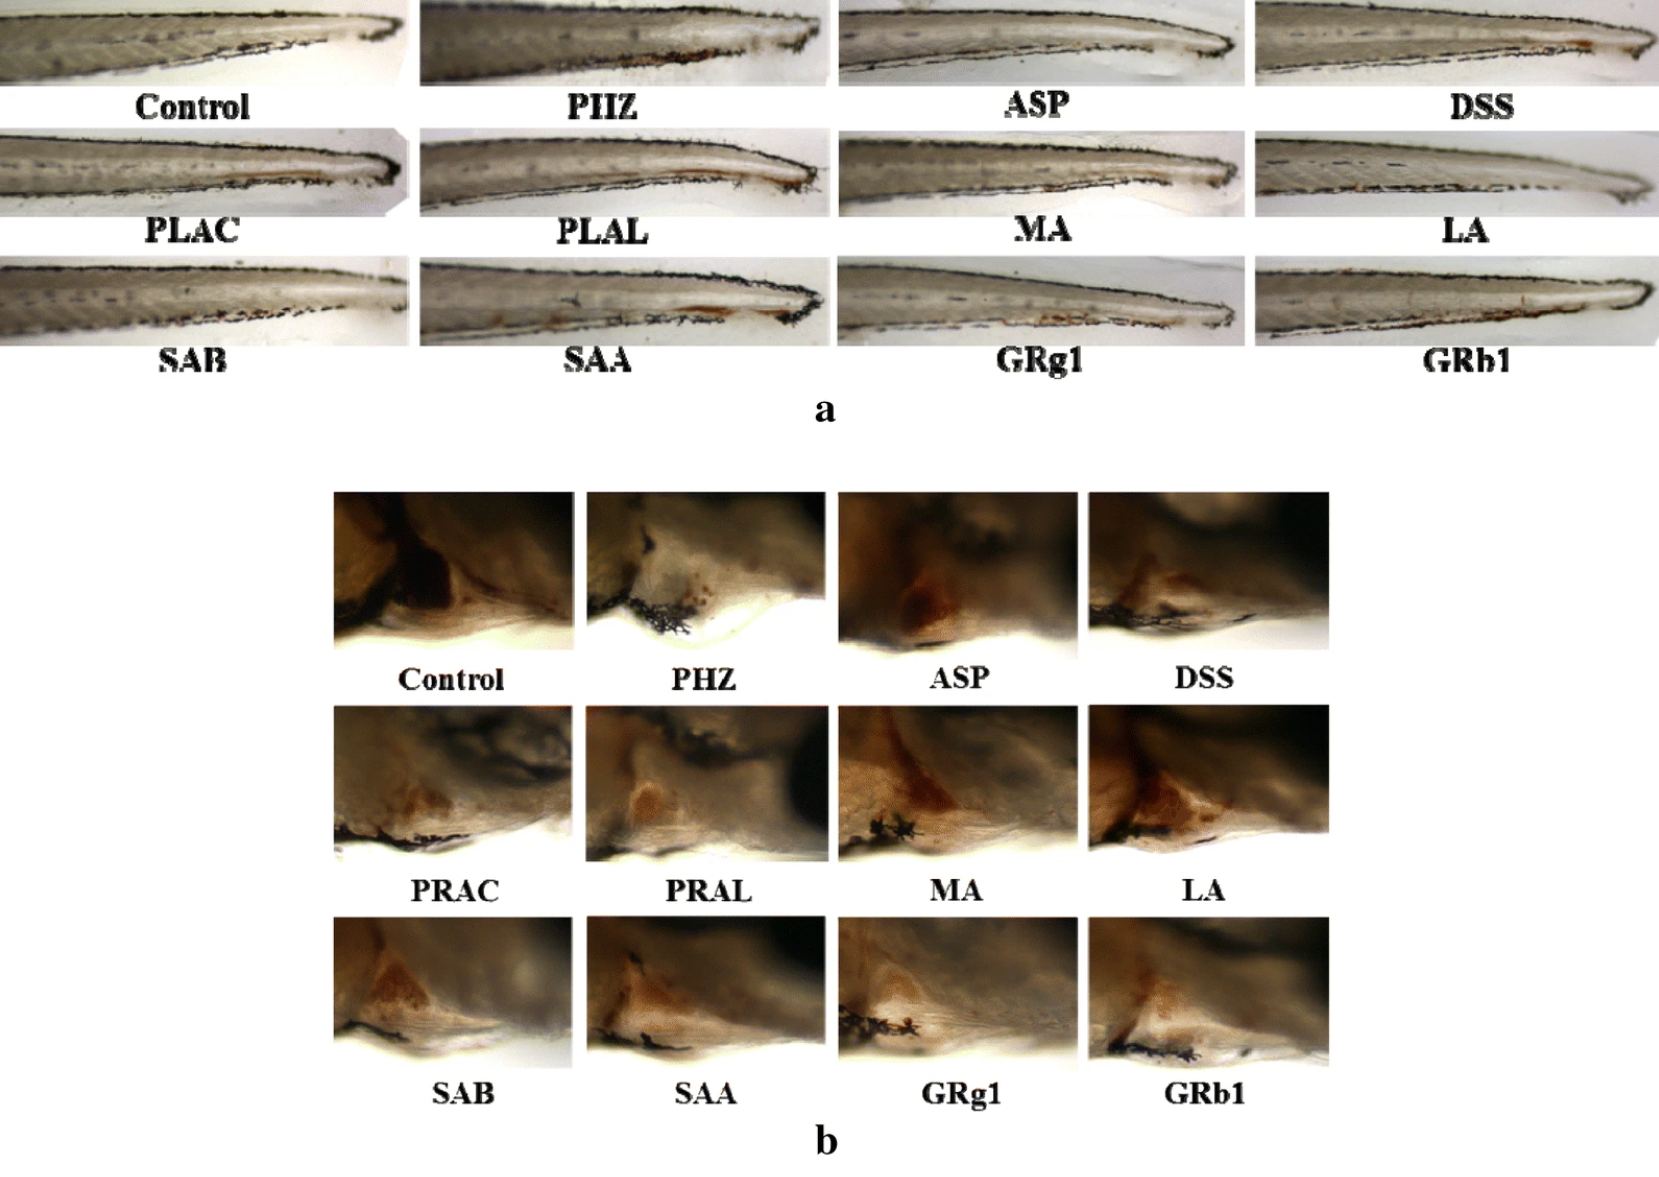
Fig. 4
Erythrocytes aggregation in the caudal vein (a) and the thrombus staining area in the heart (b) of zebrafish larvae of control group, PHZ (1.5 μM), G1 (ASP, 25 μg/mL) and G17–G25 groups (25 μg/mL of DSS, PRAC, PRAL, MA, LA, SAB, SAA, GRg1 and GRb1, respectively)
Acknowledgments
This image is the copyrighted work of the attributed author or publisher, and
ZFIN has permission only to display this image to its users.
Additional permissions should be obtained from the applicable author or publisher of the image.
Full text @ Chin. Med.