
|
Figure 2
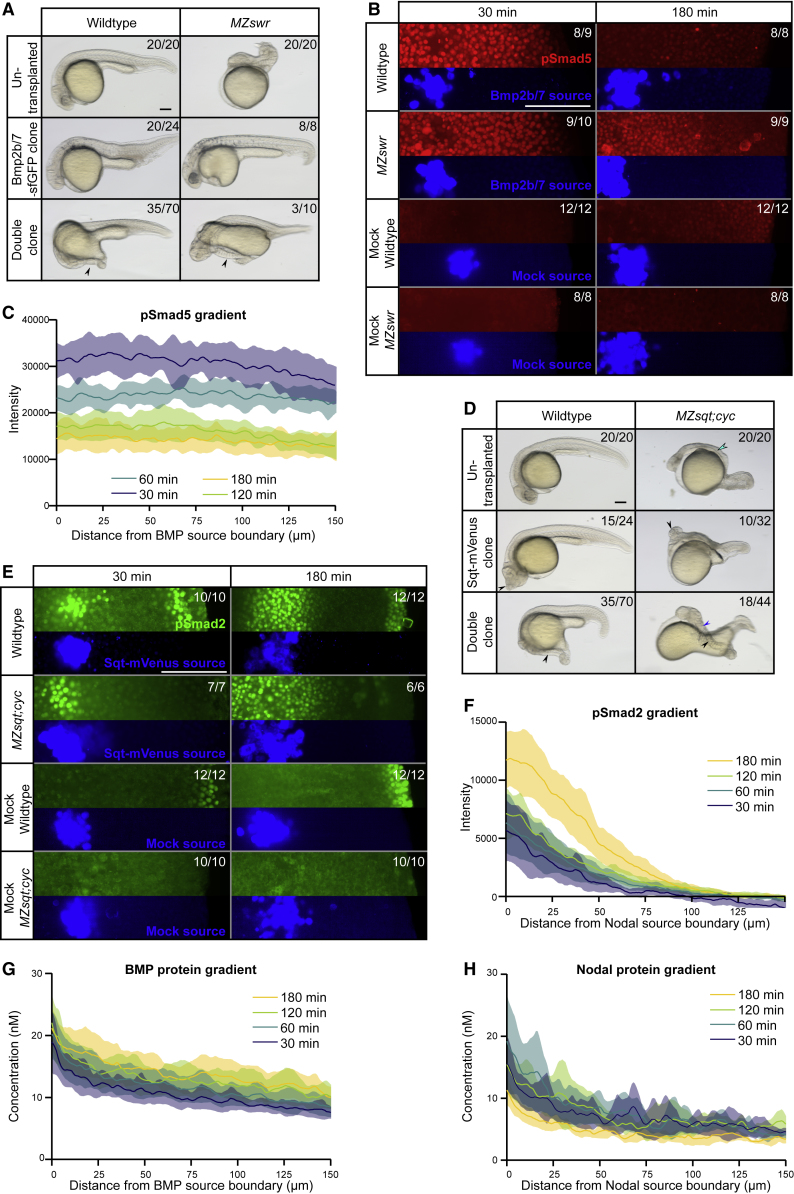
Nodal and BMP Form Similar Protein Gradients but Have Different Signaling Ranges during Secondary Axis Formation
(A) Bmp2b/7-sfGFP as well as Squint-mVenus and Bmp2b/7-sfGFP double clones in wild-type or maternal-zygotic
(B) Bmp2b/7-sfGFP clones compared to uninjected mock clones 30 min and 180 min post-transplantation in wild-type or
(C) pSmad5 distributions in embryos with single Bmp2b/7-sfGFP clones in
(D) Squint-mVenus as well as Squint-mVenus and Bmp2b/7-sfGFP double clones in wild-type or maternal-zygotic
(E) Squint-mVenus clones compared to uninjected mock clones 30 min and 180 min post-transplantation in wild-type or
(F) pSmad2 distributions in embryos with single Squint-mVenus clones in wild-type embryos at 30, 60, 120, and 180 min post-transplantation (n = 11 each). Shaded regions indicate 95% confidence intervals around the mean (lines).
(G) BMP protein gradients in wild-type embryos with single Bmp2b/7-sfGFP clones at 30, 60, 120, and 180 min post-transplantation. The same embryos were imaged throughout the time course (n = 14). Fluorescence intensity was converted to concentration based on a calibration curve using recombinant sfGFP imaged with the same microscope settings. Shaded regions indicate 95% confidence intervals around the mean (lines).
(H) Nodal protein gradients in wild-type embryos with single Squint-mVenus clones at 30, 60, 120, and 180 min post-transplantation. The same embryos were imaged throughout the time course (n = 12). Fluorescence intensity was converted to concentration based on a calibration curve using recombinant mVenus imaged with the same microscope settings. Shaded regions indicate 95% confidence intervals around the mean (lines).
See also