
Figure 4
- ID
- ZDB-IMAGE-200421-39
- Genes
- Publication
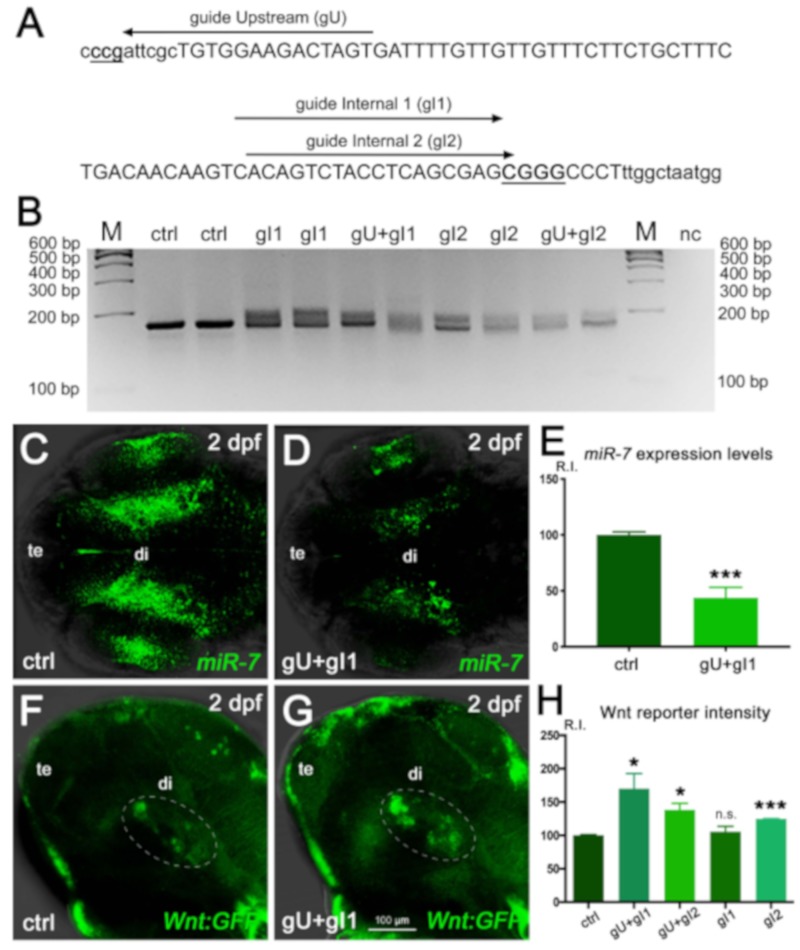
- Adusumilli et al., 2020 - miR-7 Controls the Dopaminergic/Oligodendroglial Fate through Wnt/β-catenin Signaling Regulation
- All Figures
- Figures for Adusumilli et al., 2020
|
Figure 4