
|
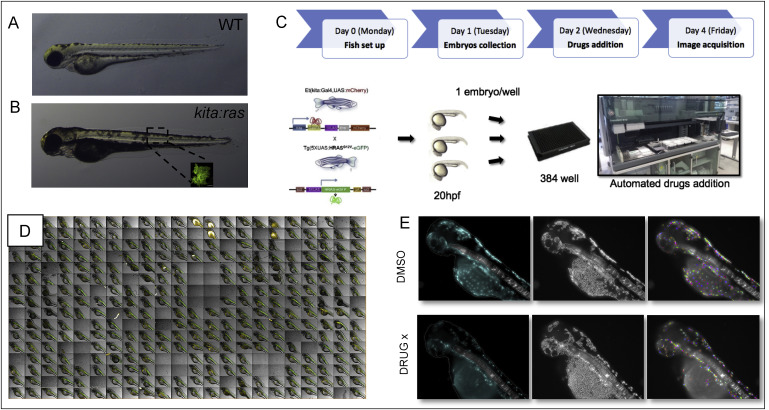
Fig. 1 Screening setup. 3dpf zebrafish (A) wild type control. (B) kita:ras. Expression of oncogenic HRAS driven by the kita promoter induces hyperpigmentation in kita:ras zebrafish larvae. (C) Overview of the drug screening experimental setup using Operetta High Content System (Perkin Elmer). (D) Overview of one of the 384 well plates used for the screen with oriented and anaesthetized larvae. (E) Examples of image analysis. Larval region was defined using the eGFP signal; the notochord signal (a marker of transgenesis) was removed using a normalized intensity threshold to avoid nonspecific segmentation. Melanocytes (here shown with different pseudo-colours during the process) were selected by automated pattern recognition relying on supervised machine learning (PhenoLOGIC®) and automatically counted.
Reprinted from Developmental Biology, 457(2), Precazzini, F., Pancher, M., Gatto, P., Tushe, A., Adami, V., Anelli, V., Mione, M.C., Automated in vivo screen in zebrafish identifies clotrimazole as targeting a metabolic vulnerability in a melanoma model, 215-225, Copyright (2019) with permission from Elsevier. Full text @ Dev. Biol.