IMAGE

Fig. 4.

ID
ZDB-IMAGE-200410-6
Source
Figures for Tambalo et al., 2020
Image
Figure Caption

Fig. 4.

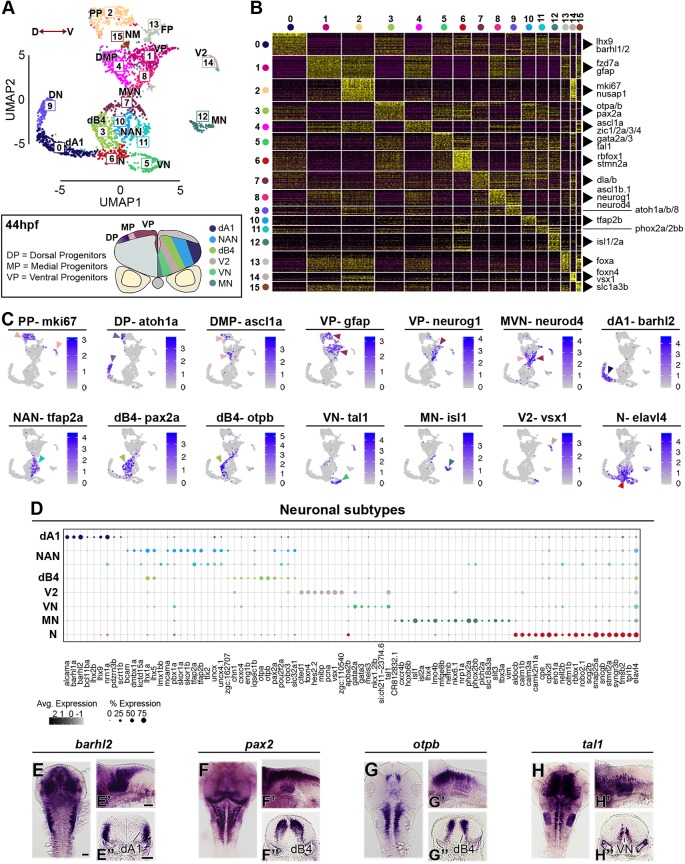
Neuronal complexity of the 44 hpf hindbrain. (A) An unsupervised UMAP plot subdivides cells into 16 clusters. Red arrowed line indicates the D-V axis. Below the UMAP is a schematic drawing of a representative transverse section of a 44 hpf zebrafish hindbrain at the level of the otic vesicle (PP, proliferative progenitors; DMP, dorsomedial progenitors; VP, ventral progenitors; MVN, medio-ventral neurogenesis; DN, dorsal neurogenesis; dB4, GABAergic interneurons; NAN, noradrenergic neurons; dA1, dorsal neurons; N, neurons; VN, ventral neurons; V2, interneurons; MN, motor neurons; FP, floor plate; NM, neuromast). (B) Heatmap of the top 30 genes significantly enriched in each cluster, representative gene names are shown close to each cluster. For the full gene list, refer to Fig. S6. (C) UMAP plots showing the log normalised counts of selective representative genes. Colour intensity is proportional to the expression level of a given gene. Arrowheads point to the relevant domain of expression; colour refers to cluster of origin. (D) Dot plot showing neuronal subtype molecular signature. Dot size corresponds to the percentage of cells expressing the feature in each cluster, while the colour represents the average expression level. Whole-mount in situ hybridisation showing the expression pattern of barhl2 (E,E′), pax2 (F,F′), otpb (G,G′) and tal1 (H-H′). (E-H) Dorsal view, (E′-H′) lateral view and (E″-H″) 40 µm hindbrain transverse section at the level of r4-r5/r5-r6. Scale bars: 50 µm.

Acknowledgments
This image is the copyrighted work of the attributed author or publisher, and ZFIN has permission only to display this image to its users. Additional permissions should be obtained from the applicable author or publisher of the image. Full text @ Development