
|
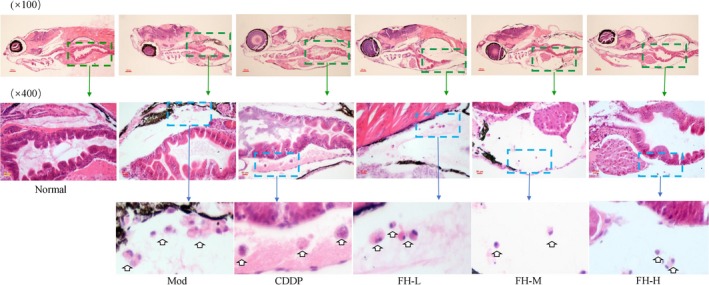
Figure 6
FH inhibited the formation of the histopathological structure of TNBC xenograft zebrafish tumor models. After xenograft tumor model was established, the tumor models were treated with FH‐L, FH‐M, FH‐H, CDDP, and control. The histology was analyzed by microscopy. The green arrow indicates that the tumor cell area observed under ×10 objective lens; the blue arrow indicates that the tumor cell area observed under ×40 objective lens. White hollow arrow indicates the tumor cell. Normal represents normal wild‐type AB strain zebrafish, Mod represents the TNBC xenograft tumor model in zebrafish, CDDP represents cisplatin (15 μg/mL), FH‐L represents Fangjihuangqi Decoction (55.5 μg/mL), FH‐M represents Fangjihuangqi Decoction (111 μg/mL), and FH‐H represents Fangjihuangqi Decoction (222 μg/mL)