IMAGE

Figure 1

ID
ZDB-IMAGE-200406-99
Antibodies
Source
Figures for Assad et al., 2020
Image
Figure Caption

Figure 1

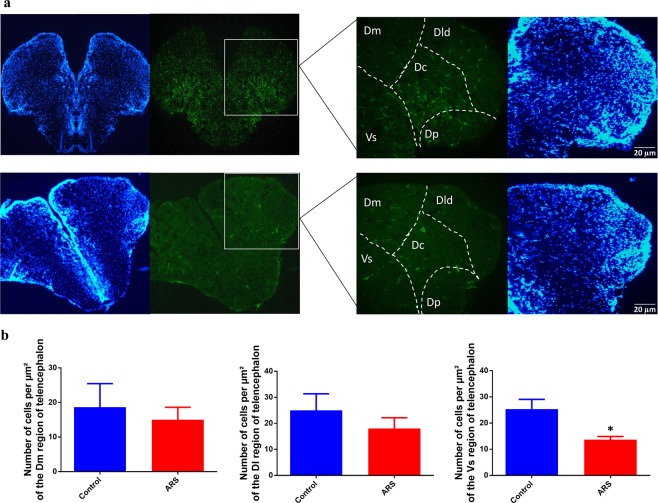
Cell activation in zebrafish brain submitted to ARS. (a) Imunofluorescence of dorsal telencephalon region of zebrafish brain. Top images shows DAPI staining (blue) and c-Fos staining (green) of control group and bottom images represents ARS group. Dm: dorsomedial telencephalon; Dl: dorsolateral telencephalon. Objective: 20x. (b) Counting of the cells marked with c-Fos in the telencephalic region of zebrafish brain. Values showed as MEAN ± S.E.M. (Student’s T test. *p < 0,05).

Figure Data
Acknowledgments
This image is the copyrighted work of the attributed author or publisher, and ZFIN has permission only to display this image to its users. Additional permissions should be obtained from the applicable author or publisher of the image. Full text @ Sci. Rep.